
- Title
-
Atoh1a expression must be restricted by Notch signaling for effective morphogenesis of the posterior lateral line primordium in zebrafish
- Authors
- Matsuda, M., and Chitnis, A.B.
- Source
- Full text @ Development
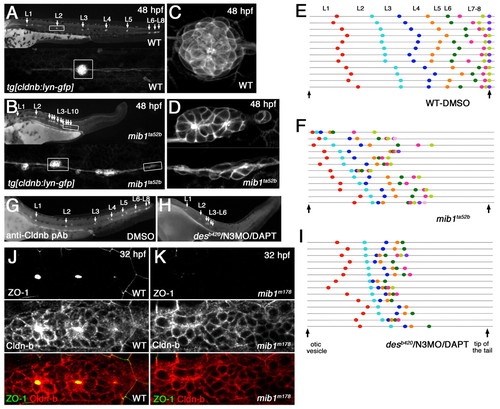
Loss of Notch signaling causes aberrant neuromast deposition and posterior lateral line primordium (pLLp) migration. (A-D) The distribution and morphology of deposited neuromasts/cell clusters (L1 to L10) in (A,C) wild-type (WT) and (B,D) mib1ta52b tg[cldnb:lynGFP] zebrafish embryos at 48 hpf. (C,D) Epithelial rosettes are disorganized in mib1ta52b mutants. (E,F,I) The pattern of neuromast/cell cluster deposition at 48 hpf in individual wild-type (E), mib1ta52b (F) and desb420/N3MO/DAPT (I) embryos. Colored dots show the position of each deposited neuromast/cell cluster relative to the otic vesicle and tail tip (vertical arrows). Individual embryos are represented on separate lines in an order determined by the relative position of L2. (G,H) The distribution of deposited neuromasts/cell clusters in DMSO-treated (G) and desb420/N3MO/DAPT (H) embryos at 48 hpf. (J,K) There is no central accumulation of ZO1 and Cldnb accumulation is delayed in mib1m178 neuromasts (K) when compared with the wild type (J) at 32 hpf. |
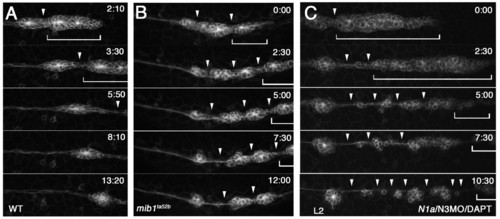
The pLLp eventually undergoes fragmentation when Notch signaling is lost. Images from time-lapse (started at <32 hpf) of (A) wild-type, (B) mib1ta52b and (C) N1/N3MO/DAPT tg[cldnb:lynGFP] zebrafish embryos. (A) In wild type, the pLLp migrates as a cohesive structure (bracket); a single break (arrowhead) allows deposition of a neuromast. See Movie 1 in the supplementary material. (B,C) The pLLp fragments as ectopic breaks develop (arrowheads), and proneuromasts are prematurely deposited in both mib1ta52b and N1/N3MO/DAPT embryos. A small portion of the remaining pLLp (bracket) continues to migrate. See Movies 3 and 4 in the supplementary material. |

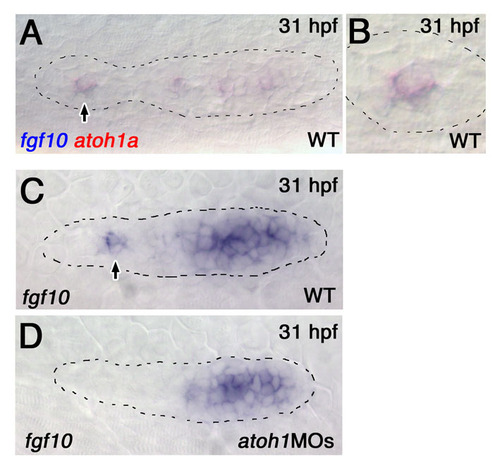
Notch signaling regulates expression of FGF signaling components. (A,B) atoh1a (A) and fgf10 (B) expression in leading and trailing proneuromasts (arrows) in wild-type and mib1ta52b zebrafish embryos at 31 and 36 hpf. There is 1° expansion of atoh1a and fgf10 expression at 31 hpf and 2° expansion by 36 hpf in mib1ta52b embryos. (C,D) fgfr1 (C) and pea3 (D) are expressed in a pattern complementary to atoh1a and fgf10 in the pLLp. Although subtle, fgfr1 and pea3 expression is reduced in the central cells in maturing proneuromasts (arrowheads). In mib1ta52b embryos, fgfr1 and pea3 expression is reduced in large clusters of cells (1° reduction) at 31 hpf (arrowheads). fgfr1 and pea3 expression is reduced in a broader domain and is restricted to the edges of the pLLp (2° reduction) by 36 hpf. |
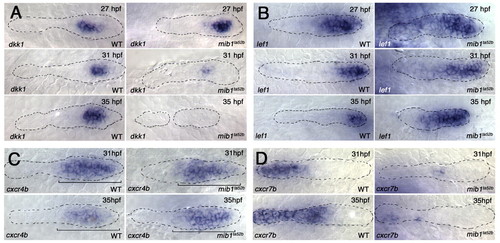
Progressive loss of FGF signaling results in loss of FGF-dependent gene expression and in expansion of Wnt-dependent gene expression. (A,B) FGF-dependent dkk1 expression is progressively lost between 27 and 35 hpf in the pLLp of mib1ta52b zebrafish embryos (A), whereas the relative size of the lef1 expression domain progressively expands (B). Note that the lef1 domain becomes progressively smaller in the older wild-type pLLp. (C,D) Whereas cxcr4b expression (C) is not significantly changed in the mib1ta52b pLLp (n=7 at 31 hpf and n=5 at 35 hpf), cxcr7b expression (D) is reduced in mib1ta52b by 31 hpf (n=9 at 31 hpf and n=6 at 35 hpf). |
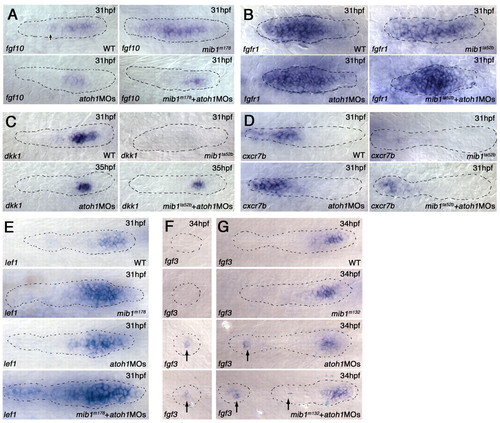
Knockdown of atoh1 function prevents loss of FGF signaling in the mib1 pLLp. (A,B) atoh1a and atoh1b knockdown prevents unregulated expansion of fgf10 expression in mib1 mutant (mib1ta52b+atoh1MOs) zebrafish embryos (n=10/10) (A). It also prevents loss of fgfr1 expression (B). Statistical analysis is shown in Fig. S10A in the supplementary material. (C) dkk1 expression is recovered in mib1ta52b+atoh1MOs embryos. For statistical analysis, see Fig. S11 in the supplementary material. (D) atoh1MOs allow partial recovery of cxcr7b expression in mib1ta52b embryos (n=5/5). (E) atoh1MOs allow lef1 expression to expand further in mib1m178 mutants. Statistical analysis is shown in Fig. S13 in the supplementary material. (F,G) Whereas there is no fgf3 expression in depositing (F) and deposited (G) neuromasts in wild-type (10/10) and mib1m132 (10/10) embryos, knockdown of atoh1 results in the persistence of fgf3 expression in wild-type (7/10) and mib1m132 (5/10) embryos. |
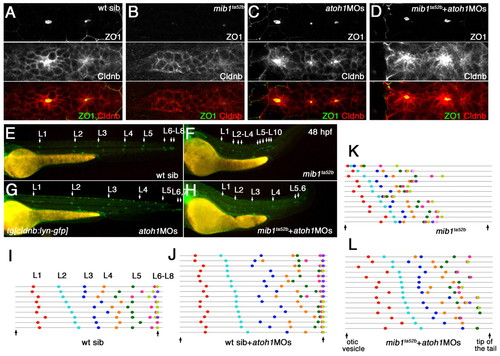
Knockdown of atoh1 reduces some morphogenesis defects in the mib1 pLLp. (A-D) The central accumulation of ZO1 and Cldnb in maturing proneuromasts (A) is lost in mib1ta52b mutants (B), but is recovered when atoh1 is knocked down (D). (E-L) The relative position of deposited neuromasts (L1 to L10) at 48 hpf (E-H). In mib1ta52b+atoh1MOs zebrafish embryos (H), neuromast distribution and pLLp migration are partially rescued. (I-L) Schematic representation of the pattern of neuromast deposition in individual embryos at 48 hpf. For statistical analysis, see Fig. S3 in the supplementary material. |
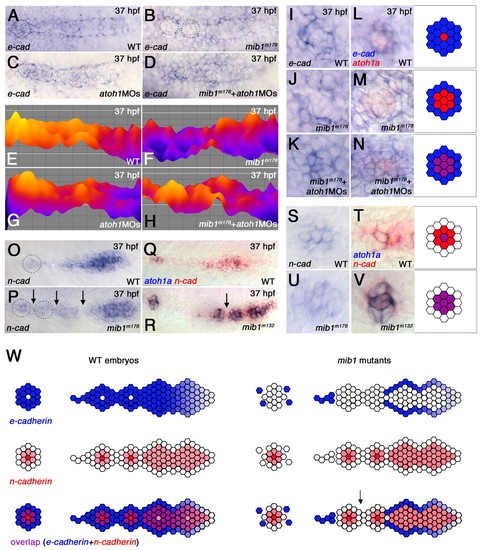
Changes in pLLp cohesion correlate with changes in Cadherin gene expression. (A-N) e-cadherin expression in the pLLp (A-H) and deposited proneuromasts (I-N) at <37 hpf. (E-H) Color-coded representations of the e-cadherin expression shown in A-D, created using the interactive three-dimensional surface plot plug-in from ImageJ (Abramoff et al., 2004). (A,E) In wild-type, e-cadherin is broadly expressed, being lower at the leading and higher at the trailing proneuromasts prior to deposition. (B,F) e-cadherin expression is suppressed in the pLLp trailing domain of mib1m178 zebrafish embryos (n=8). Dotted circles in B represent domains of suppressed e-cadherin expression. (C,G) atoh1MOs do not substantially alter e-cadherin expression in wild-type embryos (n=7). (D,H) Higher e-cadherin expression in the trailing pLLp is restored in mib1m178+atoh1MOs embryos (n=12). (I,L) e-cadherin expression (blue) is generally more intense, but absent in a central atoh1a-expressing cell (red), in deposited neuromasts (n=6). (J,M) The central atoh1a-expressing domain expands at the cost of e-cadherin in mib1m178 deposited neuromasts (n=6). (K,N) Knockdown of atoh1 in mib1m178 expands e-cadherin expression and allows overlap (purple) with atoh1a (n=13). (O-V) n-cadherin expression in the pLLp (O-R) and deposited proneuromasts (S-V). (O,Q) In wild type, n-cadherin is broadly expressed at the leading end but becomes restricted at the trailing end, prior to neuromast deposition. (P,R) In mib1m178 pLLp, n-cadherin expression is not significantly different from that of wild type. Dotted circles highlight an example of expanded expression of n-cadherin in isolated groups of cells, which are likely to represent prematurely deposited proneuromasts from a recently fragmented pLLp. (Q,R,T,V) Double in situ hybridization showing atoh1a (blue) and n-cadherin (red) expression. (S-V) In deposited neuromasts, n-cadherin expression is similar in wild type (S,T) and mib1 mutants (U,V). In wild type, a central cell expressing atoh1a and n-cadherin (purple in T) is surrounded by cells expressing only n-cadherin (red in T). In mib1 mutants, atoh1a expands and overlaps with n-cadherin (purple in V). (W) The pLLp and neuromasts normally contain cells that express e-cadherin (blue) or n-cadherin (red). Intervening cells expressing both e-cadherin and n-cadherin (purple) provide an adhesive link between cells that express distinct cadherins. When Notch signaling fails, atoh1a expression expands and e-cadherin is lost from intervening cells that would otherwise express both Cadherin genes. As e-cadherin- and n-cadherin-expressing populations are now unable to establish effective adhesive interactions, the pLLp fragments. Arrow indicates predicted point of fragmentation. |
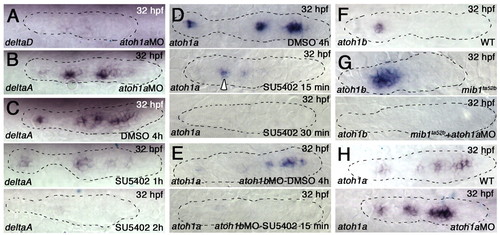
atoh1a and atoh1b cross-activation and establishment of a focal FGF signaling center. (A,B) atoh1MOs eliminate deltaD (A), but not deltaA (B), expression in the pLLp of wild-type zebrafish embryos. (C) SU5402 treatment eliminates deltaA expression after 2 hours. (D) atoh1a expression is retained in the trailing proneuromasts following 15 minutes of SU5402 exposure (middle), but is lost by 30 minutes (bottom). (E) atoh1b knockdown reduces atoh1a expression in the trailing neuromast (top). atoh1b knockdown accompanied by SU5402 exposure for 15 minutes reduces atoh1a expression throughout the entire pLLp (bottom). (F) atoh1b expression is restricted to the trailing neuromast. (G) atoh1b expression expands in mib1ta52b pLLps (top) but is lost when atoh1a MO is injected (bottom). (H) knockdown of atoh1a expands atoh1a expression at the leading end, but expanded expression is not maintained at the trailing end (bottom). |
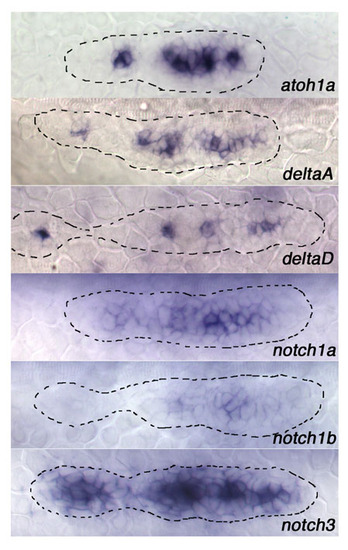
Expression of Notch signaling components in the lateral line primordium. Expression of atoh1a, Notch ligands deltaA and deltaD, and Notch receptors notch1a, notch1b and notch3, in the pLLp at 32 hpf |

Knockdown of notch1a and notch3 together with DAPT treatment inhibits expression of the Notch target gene her4 in the pLLp. (A) her4 in the wild type. (B) her4 in mib1ta52b mutant. (C) her4 in embryos treated with DAPT, a γ-secretase inhibitor. (D) notch1a and notch3 knockdown (N1a/N3MOs) results in a similar change in her4 expression. Partial inhibition of Notch signaling may paradoxically allow more cells to express her4 as its expression is also determined by proneural gene expression (Yeo et al., 2007) (data not shown). Expanded her4 expression may also result from loss of repression by additional HER factors, the expression of which is lost following DAPT treatment or N1a/N3 knockdown. (E) her4 was eliminated when embryos were treated with both DAPT and N1a/N3MOs (N1a/N3MO/DAPT). |
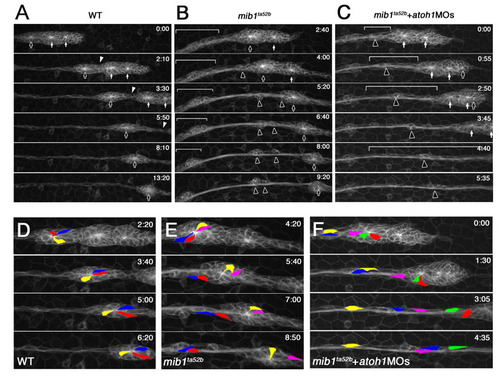
Knockdown of atoh1 does not restore the stability of deposited neuromasts in mib1 mutants. Time-lapse imaging of pLLp migration and proneuromast deposition starting at <28 hpf. In D-F, to track the movement of individual cells, three or four cells are labeled with different colors. (A) In wild-type embryos, a maturing neuromast at the trailing end of the pLLp (black arrows) slowed down and separated from the remaining pLLp following a break (white arrowheads) in the column of cells in which maturing neuromasts (white arrows) continue to migrate. See Movie 1. (B) In mib1ta52b mutants, initiation of rosette formation is not significantly affected; however, maturing neuromasts do not form stable epithelial rosettes. Black arrowheads show cells dissociating and reassociating with others after they break away from a depositing neuromast (black arrows). The white brackets show spread out cells from a previously deposited neuromast progressively trying to reassociate to form a more cohesive structure. See Movie 2. (C) Whereas knockdown of atoh1a and atoh1b function in mib1ta52b mutants significantly improved overall cohesion and migration of pLLp, it reduced cohesive interactions between cells that disassociate from deposited neuromasts. Disassociated cells within white brackets failed to reassociate and eventually became indistinguishable from interneuromast cells. See Movie 5. (D) In the wild-type, the labeled cells were maintained in the epithelial rosette during proneuromast deposition. (E) In mib1ta52b mutants, a subset of cells disassociated from a neuromast (red, blue) and eventually reassociated with cells from a previous neuromast, while others (yellow) remained in the original cell cluster. The pink cell was released from the original rosette reassociated with the pLLp. As a result, the size of the epithelial rosette at the most trailing end of the pLLp became smaller. (F) In mib1ta52b mutants injected with atoh1MOs, there was an important change in the behavior of the cells in maturing neuromasts. Although individual cells continued to disassociate from maturing neuromasts (blue, yellow, pink and green cells), there was no tendency to try and reassociate and form new clusters with previously disassociated cells or previously deposited neuromasts. Instead, they remained as individuals and became indistinguishable from other interneuromast cells normally seen between deposited neuromasts. |
Atoh1s regulate fgf10 expression in the trailing end of the pLLp. (A,B) atoh1a and fgf10 are expressed in the same cell in the trailing end of the pLLp. (A) Black arrow indicates a single atoh1a- and fgf10-expressing cell. (B) A magnified view of the single atoh1a- and fgf10-expressing cell. (C,D) atoh1a and atoh1b MOs were injected into wild-type embryos. (C) Black arrow indicates a single fgf10-expressing cell in the trailing end of the wild-type pLLp. (D) Knockdown of atoh1a and atoh1b selectively reduced fgf10 expression in this trailing domain. |
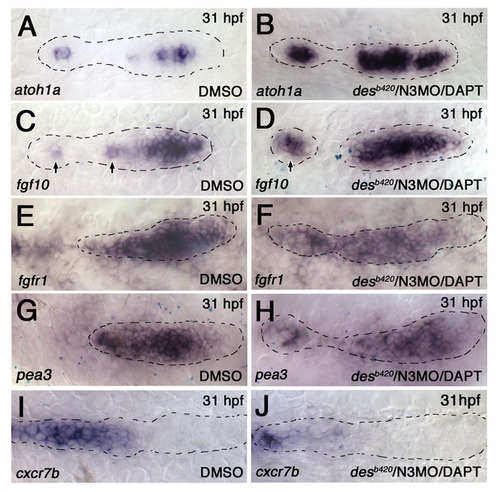
fgf10 expansion and complementary loss of fgfr1 expression and FGF-dependent gene expression in desb420/N3MO/DAPT embryos. Expression of atoh1a, fgf10, fgfr1, pea3, and cxcr7b in desb420/N3MO/DAPT embryos. (A) atoh1a expression in a wild-type pLLp is broad at the leading end but restricted to a single cell in the trailing end (arrows) (n=10/10). (B) atoh1a expression expands at the trailing end and in deposited neuromasts (arrow) in the desb420/N3MO/DAPT embryos (n=7/7). (C) fgf10 expression in a wild-type pLLp is broad at the leading end but restricted to a single cell in the trailing end (arrows) (n=7/7). (D) fgf10 expression expands at the trailing end and in deposited neuromasts (arrow) in the desb420/N3MO/DAPT embryos (n=9/9). (E,F) fgfr1 is broadly expressed in control DMSO-treated embryos. The fgfr1-negative cell at the center is hard to see in this example. The central fgfr1-negative domain expands in desb420/N3MO/DAPT embryos, as seen in the trailing neuromast in this example (n=8/8). (G,H) pea3 expression is reduced in desb420/N3MO/DAPT embryos compared with DMSO-treated control embryos (n=6/7). (I,J) cxcr7b expression is reduced in desb420/N3MO/DAPT embryos (n=6/6). |
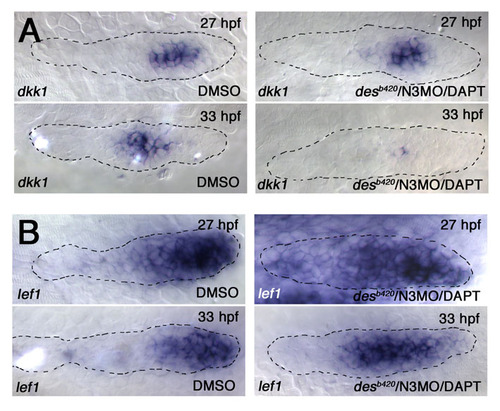
Loss of dkk1 and expansion of lef1 expression in N3MO/desb420/DAPT embryos. (A) dkk1 expression in desb420/N3MO/DAPT pLLp is unchanged at 27 hpf but is dramatically reduced by 33 hpf. See statistical analysis in Fig. S8A. (B) lef1 expression is restricted to the leading half of the pLLp at 27 hpf but is restricted to a smaller leading domain by 33 hpf in wild-type embryos (left). lef1 expression expands toward the trailing end in a desb420/N3MO/DAPT-treated pLLp by 33 hpf (n=12). |
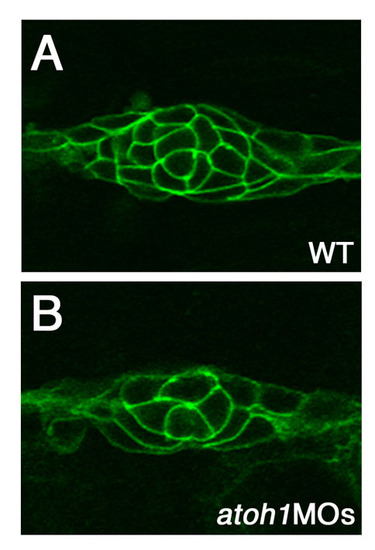
Structure of deposited proneuromasts in atoh1 morphants. Comparison of the structure of deposited proneuromasts in (A) wild type and (B) atoh1 morphants. atoh1 morphants show a slightly less organized and smaller epithelial rosette structure. |
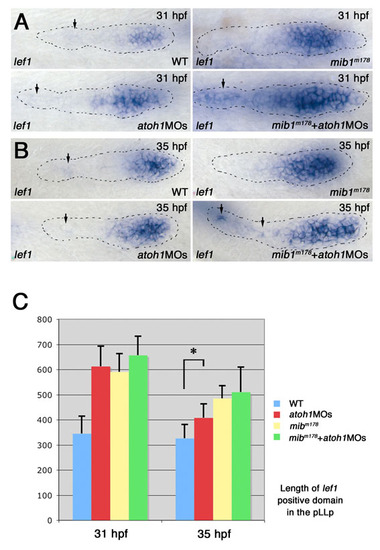
Expansion of Wnt activity is not reduced by knockdown of atoh1 in the mib1 pLLp. (A,B) Expression of lef1 in wild-type, mib1m178, atoh1a and atoh1b knockdown (atoh1MOs) pLLp, and following atoh1a and atoh1b knockdown in mib1 mutants (mib1+atoh1MOs) at 31 hpf (A) and 35 hpf (B). lef1 expression is expanded both in atoh1MOs (n=10 at 31 hpf, n=11 at 35 hpf) and mib1m178 (n=10 at 31 hpf, n=16 at 35 hpf) pLLp. Expanded lef1 expression in mib1m178 pLLp is not reduced in mib1 m178+atoh1MOs (n=6 at 31 hpf, n=13 at 35 hpf). (C) A comparison of the size of the lef1 expression domains in wild-type, mib1m178, atoh1MOs and mib1m178+atoh1MOs. The numbers of embryos used in this study are as follows: wild-type embryos, n=11 at 31 hpf, n=11 at 35 hpf; atoh1MOs embryos, n=10 at 31 hpf, n=11 at 35 hpf; mib1m178 mutant embryos, n=10 at 31 hpf, n=16 at 35 hp; mib1m178+atoh1MOs embryos, n=6 at 31 hpf, n=13 at 35 hpf. Statistical significance was measured using the Student′s t-test. *P<0.0005. |
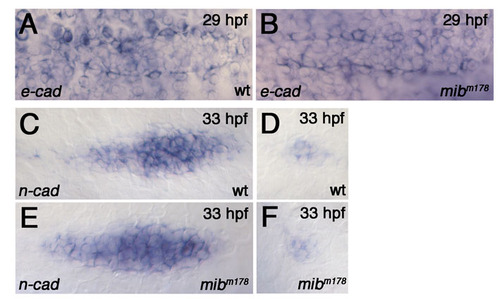
Early expression of e-cadherin and n-cadherin in the mib1 mutant pLLp. (A,B) Comparison of the pLLp in wild-type (A) and mib1m178 (B) embryos shows no obvious changes in e-cadherin expression at 29 hpf (n=8). (C-F) n-cadherin expression in the pLLp (C,E) and deposited neuromasts (D,F). Although expression in deposited neuromasts changes little, the n-cadherin-expressing domain is slightly broader in the trailing end of the pLLp at 33 hpf in mib1m178 mutants (E). |
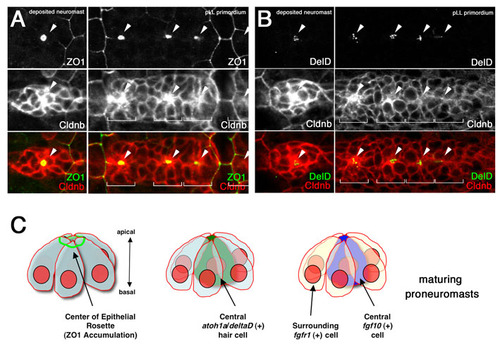
A central DeltaD-positive cell is established at the center of maturing neuromasts. (A) ZO1 is recruited to the center (white arrowheads) of maturing proneuromasts in the pLLp and in deposited neuromasts. Morphogenesis of epithelial rosettes can be followed by examining the progressive accumulation of Cldnb at the center (white arrowheads) of maturing proneuromasts. (B) A single central cell with multiple vesicles of DeltaD protein is seen at the center of the maturing epithelial rosettes. Expression of DeltaD in a single cell becomes apparent prior to obvious epithelial rosette formation, as indicated by central accumulation of Cldnb (white arrowheads). Embryos were immunostained with anti-ZO1 (green) in A and with anti-DeltaD monoclonal antibody (green) in B; Cldnb was visualized with anti-Cldnb polyclonal antibody (red). Each prospective proneuromast domain is indicated by white brackets. (C) Schematic showing central accumulation of ZO1 as epithelial rosettes mature. As the central cell expresses atoh1a and becomes a sensory hair cell precursor, it also becomes the source of DeltaD and fgf10, while neighboring cells that express fgfr1 are maintained as progenitors and become supporting cells. |
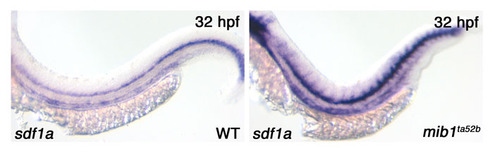
An increase in sdf1a expression in mib1 mutants. Expression of the chemokine sdf1a over the horizontal myoseptum is increased in mib1 embryos. This is also likely to influence pLLp migration. |