
- Title
-
Notch signalling regulates left-right asymmetry through ciliary length control
- Authors
- Lopes, S.S., Lourenço, R., Pacheco, L., Moreno, N., Kreiling, J., and Saude, L.
- Source
- Full text @ Development
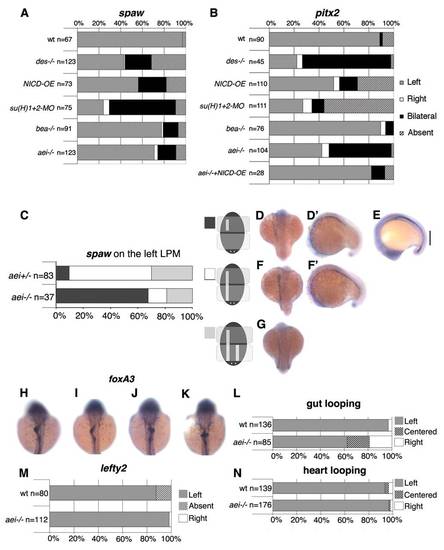
Canonical Notch signalling through the DeltaD ligand controls left-right patterning. (A,B) Percentages of normal (Left, grey), reversed (Right, white), bilateral (black) and absent (stripes) expression of spaw (A) and pitx2 (B) in the lateral plate mesoderm when Notch signalling was challenged. Embryos were analysed between the 14- and 18-somite stages for spaw expression and between the 18- and 20-somite stages for pitx2. (C) Percentages of different domains of left-sided expression of spaw in the lateral plate mesoderm. (D,D2,F,F2,G) In aei-/- embryos, spaw may be expressed in an anterior domain only (D,D′), in an anterior with bilateral posterior domains (F,F′), and in anterior and posterior domains with competition on the right side (G). (E) A double spaw and lefty1 in situ hybridization showing the posterior gap (vertical line) of these two markers in an aei-/- embryo. (H-K) Expression of foxa3 in the gut in 50-53 hpf embryos (dorsal views). In wild-type embryos, the gut loops to the left (H). In aei–/– embryos, the gut may loop to the left (I), or to the right (J), or show no looping (K). (L) Percentages of normal (Left), reversed (Right) or no looping of the gut at 50-53 hpf. (M) Percentages of normal (Left), reversed (Right) or absent lefty2 in the lateral plate mesoderm at the 26-somite stage. (N) Percentages of normal (Left), reversed (Right) or no jogging (Centered) of the heart at 30-32 hpf. EXPRESSION / LABELING:
PHENOTYPE:
|
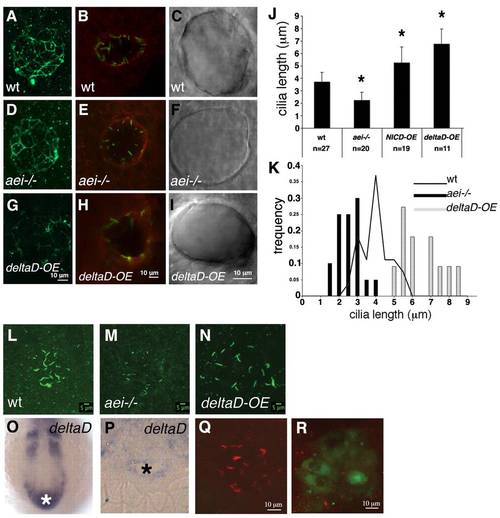
DeltaD regulates cilia length in the Kupffer′s vesicle.(A,D,G) ZO-1 immunostaining of a representative wild-type embryo (A), an aei-/- mutant embryo (D) and a deltaD-overexpressing embryo (G). (B,E,H) aPKC immunostaining of a representative wild-type embryo (B), an aei-/- mutant embryo (E) and a deltaD-overexpressing embryo (H). (C,F,I) DIC images of live embryos showing a wild-type KV (C), a KV from an aei-/- embryo (F) and a KV from a deltaD-overexpressing embryo (I). (J) Quantification of ciliary length at 10-somite stages in wild type, in aei-/- mutants and in embryos where Notch signalling was hyperactivated by overexpressing NICD (NICD-OE) or deltaD (deltaD-OE). Asterisks indicate experimental conditions that produce changes that are significantly different from wild type (P<0.001, Student′s t-test, two tail for two samples assuming unequal variances). (K) Histogram showing the distribution of Kupffer′s vesicle ciliary length at 10-somite stages in aei-/- mutant embryos (black bars), wild-type embryos (black line) and embryos subjected to deltaD-OE (grey bars). (L-N) Confocal images of all z-sections spaced 1 µm apart through the entire ciliated Kupffer′s vesicle at the 10-somite stage. Cilia are labelled with anti-acetylated α-tubulin in a wild-type embryo (L), an aei-/- mutant (M) and an embryo subjected to deltaD-OE (N). (O,P) Wild-type deltaD expression at the 10-somite stage in whole mount (O) and in resin section (P). The white and the black asterisks label the position and the lumen of the Kupffer′s vesicle, respectively. (Q,R) deltaD-MO co-injected with fluorescein lineage tracer in the dorsal forerunner cells (DFCs). (Q) Injected embryo with non-targeted Kupffer′s vesicle cells showing normal length cilia. (R) Fluorescein-positive Kupffer′s vesicle cells with shorter cilia. Error bars indicate s.d.m. EXPRESSION / LABELING:
PHENOTYPE:
|
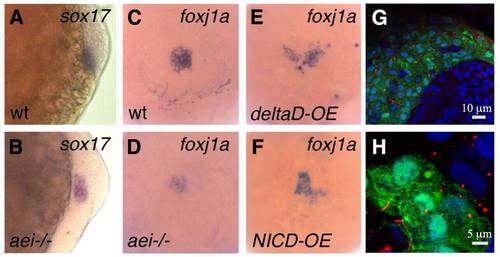
DeltaD modulates foxj1a expression. (A,B) Expression pattern of sox17 in Kupffer′s vesicle precursor cells at bud stage in wild-type (A) and aei-/- mutant (B) embryos. (C-F) Expression pattern of foxj1a in Kupffer′s vesicle precursor cells at bud stage in a wild-type (C), an aei-/- mutant (D), a wild type overexpressing deltaD and a wild type overexpressing NICD (F). (G,H) Foxj1a mRNA injection increases ciliary length. (G) Tail region of an aei-/- mutant embryo showing GFP-positive cells that were co-targeted with foxj1a and GFP mRNA. In these cells, cilia are much larger than in adjacent non-targeted cells. (H) Cells from the Kupffer′s vesicle in an aei-/- mutant embryo that was co-injected with foxj1a and GFP mRNA showing rescued motile cilia judged by the increased ciliary length. α-Acetylated tubulin labels cilia in red, DAPI labels DNA in blue and GFP labels targeted cells in green. EXPRESSION / LABELING:
|
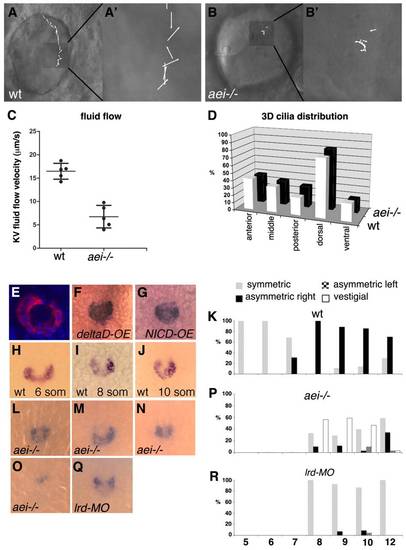
Short cilia reduce fluid flow inside Kupffer′s vesicle and compromise charon asymmetric expression. (A-B′) Still images from wild-type siblings (A) and aei-/- mutant embryos (B) taken from Movies 1 and 2, respectively, in the supplementary material. Inserts A′ and B′ show vectors representing the fluid flow velocity and direction in each experimental situation. (C) Quantification of the average fluid flow velocity in wild type (n=5, 16.46±1.69 μm/s) and in aei–/- mutants (n=5, 6.74±2.41 μm/s). (D) Percentage of cilia in different regions of Kupffer′s vesicle (anterior, middle, posterior, dorsal and ventral) in wild-type (n=19) and aei-/- mutant embryos (n=14). (E) A 10-somite stage embryo showing nuclei stained with DAPI in blue and charon mRNA cytoplasmic localization in the epithelial cells that surround the lumen of Kupffer′s vesicle. (F,G) Expression pattern of charon in Kupffer′s vesicle of embryos overexpressing deltaD (F) and NICD (G). (H-J) charon expression at Kupffer′s vesicle is symmetric at the six-somite stage (H) and is asymmetric at the eight- and ten-somite stages (I,J). (K) Percentage of symmetric versus asymmetric charon expression in Kupffer′s vesicle in wild-type embryos from five- to 12-somite stages (n=18 for each stage). (L-O) Range of expression patterns of charon in Kupffer′s vesicle of aei-/- mutant embryos; charon expression may be symmetric (L), asymmetric with stronger expression on the right (M), asymmetric with stronger expression on the left (N) or reduced (O). (P) Percentages of the different charon expression patterns in Kupffer′s vesicle in aei-/- mutant embryos from the eight- to 12-somite stages (n=34 on average for each stage). (Q) charon expression pattern in Kupffer′s vesicle of one representative lrd1 morphant. (R) Percentage of symmetric versus asymmetric charon expression in Kupffer′s vesicle of lrd1 morphants from the eight- to 12-somite stages (n=27 on average for each stage). EXPRESSION / LABELING:
|
Elimination of Cut from the SB cells leads to cell death and abnormal morphology of the adult spiracles. (A-A′′) btl-Gal4 UAS-srcGFP; UAS-cutRNAi reared at 29°C stained for Cut (red in A,A′) and DAPI (blue), green is GFP (A,A′′); Cut protein is eliminated following overexpression of the UAS-cutRNAi transgene at 29°C. (B-B′′) esg-Gal4 UAS-EGFP; UAS-cutRNAi reared at 29°C stained for DE-Cadherin (red in B,B′) and DAPI (blue in B,B′′); loss of Cut reduces the number of SB tracheoblasts, and causes cell death (nuclei with disrupted morphology) and breaks in the SB (yellow arrow). Scale bar: 20 μm. (C) Dorsal view of the abdomen of an esg-Gal4 UAS-EGFP adult female showing wild-type morphology of the tergites. (C′,C′′) Ventral view of the wild type abdomen shown in C containing seven pairs of spiracles (red arrowheads). (D) Dorsal view of the abdomen of an esg-Gal4 UAS-EGFP; UAS-cutRNAi adult female reared at 29°C. Abnormal morphogenesis of the tergites is observed, possibly because Cut is involved in the morphogenesis of the abdominal histoblasts. (D′,D′′) Ventral view of the abdomen shown in D where fewer spiracles (red arrowheads) are formed compared with wild type. Necrotic tracheal tissue in D′ is indicated by a black arrow. |