
- Title
-
Cranial vasculature in zebrafish forms by angioblast cluster-derived angiogenesis
- Authors
- Proulx, K., Lu, A., and Sumanas, S.
- Source
- Full text @ Dev. Biol.
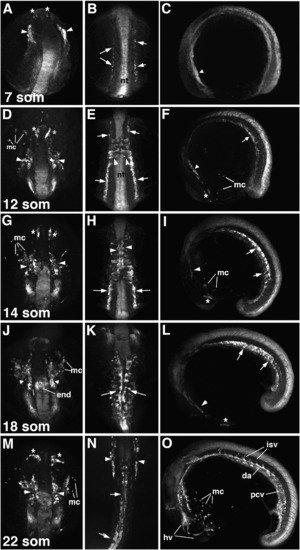
Etsrp:GFP expression at the 7–22 somite stages. (A,D,G,J,M) Dorso-anterior view, anterior is up. (B,E,H,K,N) Dorsal view, anterior is up. (C,F,I,L,O) Lateral view, anterior is to the left. (A–C) 7-somite stage embryos. Note GFP expression in the endothelial and myeloid cell precursors within the rostral (ROC, asterisks, A) and the midbrain organizing centers (MOC, arrowheads, A,C) and in the angioblasts within posterior lateral plate mesoderm (PLPM, arrows, B). Neural tube (nt) displays non-specific GFP expression. (D–I) 12-somite (D–F) and 14-somite (G–I) stage embryos. Note GFP expression in the ROC (asterisks, D,F,G,I) and the MOC (arrowheads, D,F,G,I). Myeloid cells (mc) are migrating out from the ALPM. Bilaterally located GFP-expressing angioblasts within PLPM (arrows, E,F,H,I) migrate towards midline (arrowheads, E) where they aggregate into vascular cords to form axial vessels (arrowheads, H). (J–O) 18-somite (J–L) and 22-somite (M–O) stage embryos. GFP expression is apparent within endothelial and myeloid cell precursors in the ROC (asterisks, L,M) and the MOC (arrowheads, J,M) as well as in the endocardial precursors (end, J). Myeloid cells are migrating out of the ALPM. Angioblasts in the posterior part of an embryo aggregate into the vascular cords (arrows, K,L,N) that form the dorsal aorta (da) and the posterior cardinal vein (pcv). GFP fluorescence in intersegmental vessels (isv) is apparent. Intense GFP expression is observed at the rostral part of pcv (arrowheads, N). MOC and ROC-derived endothelial cells migrate to form head vessels (hv, O). |
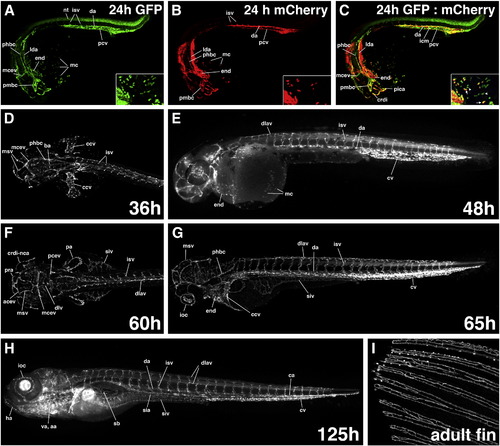
Etsrp:GFP expression at 24 hpf and older embryos. (A–C,E,G,H) Lateral view, anterior is to the left; (D,F) dorsal view, anterior is to the left. (A–C) Comparison of etsrp:GFP (A) and kdrl:mCherry (B) expression at 24 hpf as observed in GFP (A), mCherry (B) channels and merged (C). Overlapping GFP and mCherry expression is observed in the dorsal aorta (da), posterior cardinal vein (pcv), intersegmental vessels (isv), cranial vessels that include lateral dorsal aorta (lda), primordial hindbrain channel (phbc), primordial midbrain channel (pmbc), middle cerebral vein (mcev), cranial division of internal carotid artery (crdi) and primitive internal carotid artery (pica) as well as the endocardium (end). There is apparent etsrp:GFP but not kdrl:mCherry expression in the intermediate cell mass region (icm) between da and pcv (C). Etsrp:GFP expression is present in multiple myeloid cells (mc) while flk1:mCherry is present only in some etsrp-expressing mcs (A–C, inset). GFP+mCherry- (arrowheads) and GFP+mCherry+ (arrows) mc populations are shown in the inset, C. Intense mCherry expression next to lda is in the pharyngeal endoderm. (D–H) Etsrp:GFP expression at 36 hpf (D, anterior part), 48 hpf (E), 60 hpf (F, anterior part), 65 hpf (G), 125 hpf (H). GFP fluorescence is apparent in all vascular endothelial cells that include da, pcv, isv, dorsal longitudinal anastomotic vessel (dlav), phbc, mcev, basilar artery (ba), mesencephalic vein (msv), common cardinal vein (ccv), anterior cerebral vein (acev), posterior cerebral vein (pcev), prosencephalic artery (pra), crdi-nasal ciliary artery (nca), dorsal longitudinal vein (dlv), inner optic circle (ioc), supraintestinal artery (sia), subintestinal vein (siv), hypobranchial artery (ha), ventral aorta (va), aortic arches (aa), pectoral artery (pa), swim bladder (sb), caudal artery (ca) and caudal vein (cv). GFP fluorescence is present also in the endocardium (end) and myeloid cells (mc). (I) Etsrp:GFP expression in the vasculature of adult caudal fin. Caudal fin edge is to the left. |
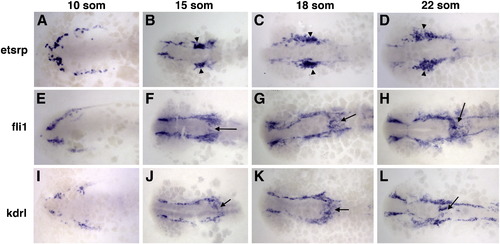
Comparison of etsrp, fli1 and kdrl expression in ALPM at the 10-somite (A,E,I), 15-somite (B,F,J), 18-somite (C,G,K) and 22-somite (D,H,L) stages. Dorsal view of the anterior region of flat-mounted embryos, anterior is to the left. (A–D) etsrp, (E–H) fli1, and (I–L) kdrl expression. While all three genes are expressed in endothelial cell precursors, they exhibit the following differences. Intense etsrp expression is present within the MOC (arrowheads, B–D) in the myeloid and, possibly, endothelial progenitors. Note that etsrp is not expressed in myeloid progenitors once they leave the MOC. Both fli1 and kdrl but not etsrp exhibit expression in the endocardial precursors (arrow, F–H,J–L). |
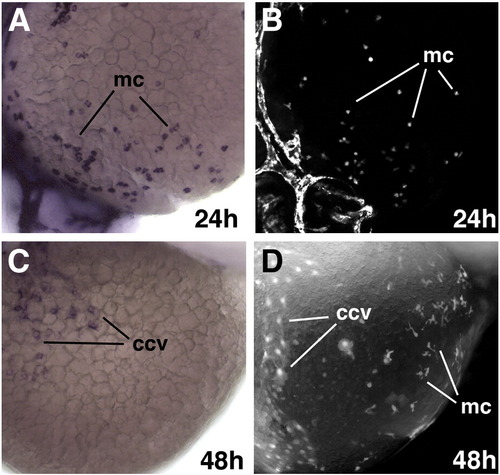
GFP protein is present in the myeloid cells after RNA is no longer transcribed in etsrp:GFP transgenic embryos. (A,C) In situ hybridization for GFP RNA at the ventral part of the yolk at 24 hpf (A) and 48 hpf (C). (B,D) GFP fluorescence at 24 hpf (B) and 48 hpf (D). Note that both GFP RNA and protein are present in the myeloid cells (mc) at 24 hpf while only GFP protein but not RNA is detected at 48 hpf. GFP RNA and protein are both present within the common cardinal vein (ccv) (C,D). |
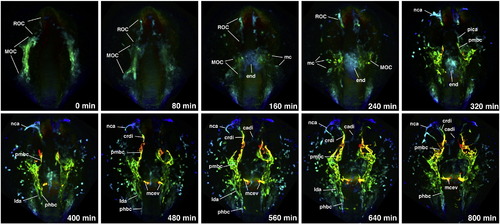
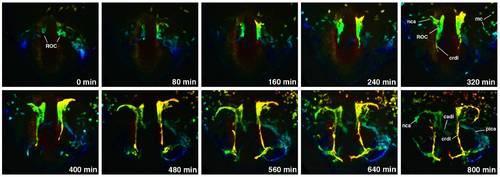
Depth-coded time-lapse images of cranial vessel formation in etsrp:GFP transgenic line from the 10-somite to approximately 22 hpf stages. Blue colors corresponded to the deepest cells while red colors mark the closest ones. Dorso-anterior view of the head region, anterior is to the top. 0–240 min. Endothelial cells separate into two populations. The most rostral cells migrate individually and coalesce into the rostral organizing center (ROC) while more posteriorly located cells coalesce into the midbrain organizing center (MOC). A subpopulation of MOC cells which include endocardial (end) and myeloid precursors migrate deep inside towards the midline. Multiple myeloid cell (mc) precursors migrate out of the MOC. 320–800 min. Angiogenic extensions originate in the ROC and the MOC. Crdi extends dorsally and posteriorly from the ROC and joins with pmbc which extends anteriorly from the MOC. lda and phbc migrate posteriorly from the MOC. Individual endothelial cells migrate ventrally to form cadi. Nca branches from the ROC but does not form connections until later stages. |
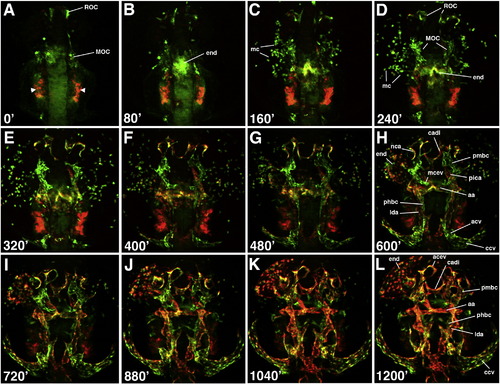
Time-lapse images of cranial vessel formation in etsrp:GFP; kdrl:mCherry transgenic line from the 12-somite to approximately 32 hpf stages. Dorsal view of the anterior part of an embryo, anterior is to the top. (A–D) Cranial vessels originate from the rostral (ROC) and the midbrain organizing centers (MOC). Endocardial precursors (end) originate at the MOC and migrate to the midline by the 15-somite stage (B). Myeloid precursors (mc) migrate out of the MOC and disperse. There is very little kdrl:mCherry expression in cranial vessels during these stages. Most myeloid cells display only etsrp:GFP expression. Endocardial cells express both GFP and mCherry. Intense bilateral kdrl:mCherry expression posterior to the MOC is within pharyngeal endoderm. (E–H) Cranial vessels form angiogenic extensions from the ROC and the MOC. The rostral cranial vessels including acev and cadi originate at the ROC while mcev, phbc, pmbc and lda extend from the MOC. phbc and lda posterior extensions join with their counterparts that originate more posteriorly at acv/pcv and da and migrate anteriorly (G,H). Note that many venous vessels such as mcev, pmbc, and phbc display significantly stronger GFP expression and little or no mCherry expression while arterial vessels such as lda and aa display strong mCherry and weak GFP expression. The most rostral vessels such as acev and cadi express both GFP and mCherry. Endocardium which migrates to the left in (H) is positive for both reporter proteins while most myeloid cells express exclusively GFP. (I–L) Most cranial vessels lumenize and initiate circulation during these stages. The majority of cranial vessels now upregulate kdrl:mCherry expression and do not display significant differences in GFP and mCherry relative fluorescence levels. |
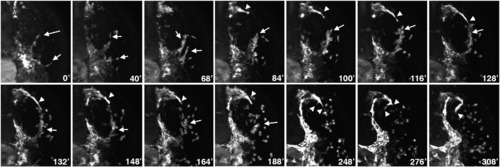
Time-lapse images of myeloid cell migration. Dorsal view of the anterior right side of an embryo in the midbrain–forebrain area, anterior is up. Images start at the 14-somite stage; selected frames are shown. Note that the early myeloid precursors migrate in rows (arrows) and maintain cell–cell adhesion. A string of myeloid cell precursors migrates around the posterior-ventral side of the optic cup (arrow, 84–148 min). At the same time, endothelial precursors of nca vessel migrate at the anterior side of the optic cup (arrowheads, 84–188 min). During a short period of time, myeloid cells disperse and continue migration as individual cells (arrow, 164, 188 min). Nca vessel stalls, extends filopodia (arrowheads, 248 min) and then makes a 90° turn (276–308 min). |
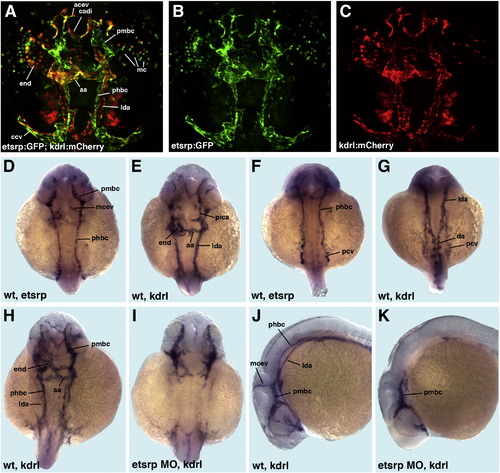
Etsrp expression is enriched in venous cranial vessels while kdrl shows preferential arterial expression. (A–C) Anterior part of etsrp:GFP; kdrl:mCherry transgenic embryo at 24 hpf, dorsal view, anterior is to the top. (A) Merged image; (B) GFP channel; (C) mCherry channel. Note that venous vessels in the midbrain and hindbrain regions such as pmbc and phbc display strong GFP and weak mCherry expression while arterial vessels such as lda display weak GFP and strong mCherry expression. The most rostral vessels such as acev are positive for both GFP and mCherry. (D–G). In situ hybridization for etsrp (D,F) and kdrl (E,G) expression; dorsal view of the forebrain–midbrain region (D,E) and the hindbrain region (F,G) at 24 hpf. Anterior is to the top. Note that venous vessels in the midbrain and hindbrain regions such as pmbc, mcev, and phbc and the anterior part of pcv display intense etsrp expression while arterial vessels such as lda, aa, and pica and the anterior part of da display strong kdrl expression. (H–K). Both arterial and venous vessels are absent or reduced in etsrp morphants as analyzed by kdrl expression. (H,I) Dorsal view of the anterior region, anterior is to the top; (J,K) lateral view of the anterior region, anterior is to the left. (H,J) Control uninjected embryos, (I,K) etsrp morphants. Note that both arterial and venous vessels such as phbc and lda are absent in etsrp morphants. Only vessels that are closest to the MOC and the ROC such as pmbc partially form. |
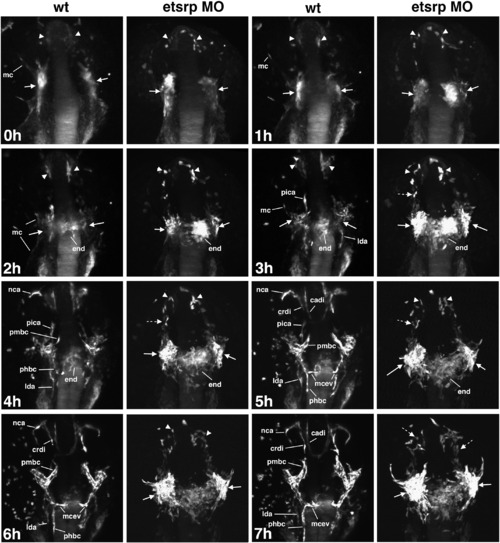
Projection time-lapse images of cranial vessel formation in etsrp:GFP control (wt) and etsrp-MO injected embryos starting at approximately the 11-somite stage. Dorsal view of the anterior part of an embryo, anterior is to the top. 0–2 h: etsrp:GFP-expressing cells within ALPM coalesce into ROC (arrowheads) and MOC (arrows). Myeloid cells (mc) start to migrate out from MOC in wt embryos. In etsrp morphants, the initial ROC and MOC formation proceeds normally. No or very few migrating myeloid cells are present in etsrp morphants. 3–5 h: Angiogenic extensions that will give rise to cranial vessels including pica, phbc, lda and nca appear in wt embryos but not etsrp morphants. Significantly fewer myeloid cells are present in etsrp morphants than wild-type embryos (5 h panel). Note that multiple etsrp:GFP cells remain separated in etsrp morphants (dashed arrows) while all endothelial cell progenitors have migrated either to MOC or ROC in wt embryos. Migration of endocardial precursors (end) appears unaffected in etsrp morphants. 6–7 h: In wt embryos, ROC-derived crdi joins with MOC-derived pmbc. Angiogenic extensions of multiple other cranial vessels, including phbc, lda, mcev, cadi, and nca are apparent. In etsrp morphants, etsrp:GFP expression is bright and strong in the MOC area (arrows) where many endothelial cells originate but fail to migrate and only limited angiogenic extensions are apparent at these stages. Multiple endothelial cells in the ROC and in-between ROC and MOC remain separated and fail to coalesce into functional vessels (dashed arrows, 7 h). |
Depth-coded time-lapse images of cranial vessel formation in etsrp:GFP transgenic line from the 10-somite to approximately 22 hpf stages. Blue colors corresponded to the deepest cells while red colors mark the closest ones. Dorso-anterior view of the ROC region, anterior is to the top. This view is more rostral, compared to Fig. 5. |

Individual cell migration and extension of lda and phbc in etsrp:GFP line. (A) Migration of ROC and MOC progenitors during the 10-16-somite stages. Dorso-anterior view of the head region, anterior is up. Selected cells were manually traced using time-lapse imaging data and labeled with different colors. It was not possible to follow every cell though all the stages. Note that ROC progenitors actively migrate as individual cells and eventually adhere to their neighbors, forming one of ROC-derived vessels. Bilateral stripes of MOC progenitors converge towards the midline as the embryo undergoes convergent extension. The rostral MOC progenitors, including the cell marked in red migrate as a group posteriorly and towards the midline, many of them contributing to the pool of endocardial progenitors. (B) Anterior portions of the arterial lda (arrows) and venous phbc (arrowheads) originate in the MOC region at the 14-18 somite stages. Depth-coded dorsal view of etsrp:GFP embryo, anterior is up. Blue colors mark deeper cells, while red colors mark closer cells. Time scale begins at the start point of imaging (10-somite stage, Movie 12). Arrowhead and arrows in 160 and 220 min panels point to the areas where lda and phbc originate before angiogenic extensions become apparent. A posterior portion of lda that originates from the dorsal aorta can be seen in the 380 min panel (lower arrowhead). end, endocardial precursors. |
Reprinted from Developmental Biology, 348(1), Proulx, K., Lu, A., and Sumanas, S., Cranial vasculature in zebrafish forms by angioblast cluster-derived angiogenesis, 34-46, Copyright (2010) with permission from Elsevier. Full text @ Dev. Biol.