
- Title
-
Allometric growth of the trunk leads to the rostral shift of the pelvic fin in teleost fishes
- Authors
- Murata, Y., Tamura, M., Aita, Y., Fujimura, K., Murakami, Y., Okabe, M., Okada, N., and Tanaka, M.
- Source
- Full text @ Dev. Biol.
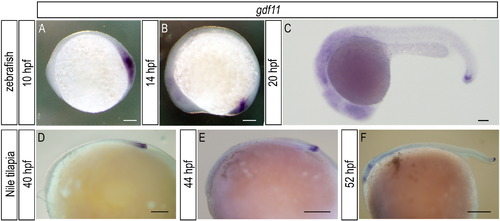
gdf11 is expressed in the posterior end of the body in both zebrafish and Nile tilapia embryos. (A-C) Expression of gdf11 in zebrafish embryos at the times indicated. (D-F) Expression of gdf11 in Nile tilapia embryos at the times indicated. There was no significant difference in the distribution of gdf11 transcripts between zebrafish and Nile tilapia embryos. Scale bars: 100 μm for panels (A), (B) and (C); 500 μm for panels (D), (E) and (F). EXPRESSION / LABELING:
|
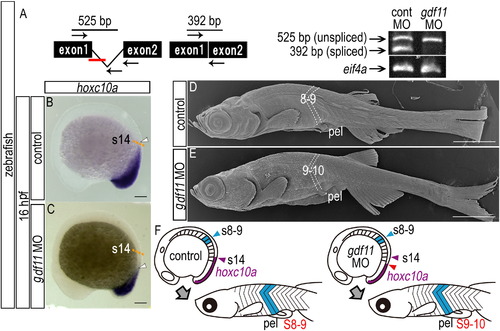
A common mechanism underlies the positioning of paired appendage via gdf11 expression levels in both teleosts and tetrapods. (A) RT-PCR analysis to determine the efficiency of the gdf11 splice-blocking morpholino (MO). In the schematic diagrams, arrows represent forward and reverse primers, and the short red bar represents the gdf11 MO. RT-PCR products were analyzed by agarose gel electrophoresis. Products of 392 bp and 525 bp represent spliced and unspliced gdf11 mRNA, respectively. Amplification of eif4a cDNA was used as a control. (B, C) Expression of hoxc10a in 16 hpf embryos injected with control MO (B) and gdf11 MO (C). The orange dashed line indicates the hoxc10a positive region of control morphant in (B). Caudal displacement of the anterior border of hoxc10a expression in the spinal cord (white arrowheads) is seen in the gdf11 morphant (C). (D, E) Scanning micrographs of zebrafish larvae. (D) Control (TL 10.5 mm). (E) gdf11 morphant (TL 10.1 mm). (F) Diagrams show the domains of hoxc10a expression in the spinal cord (purple) of control and gdf11 morphants. The anterior border of hoxc10a expression in the spinal cord of the control (opposite somite 14) and of gdf11 morphants are indicated by purple and red arrowheads, respectively. Pelvic fins of control larvae appear opposite the 8th-9th segments (blue). pel, pelvic fin. Scale bars: 100 μm for panels (B) and (C); 1 mm for panels (D) and (E). EXPRESSION / LABELING:
PHENOTYPE:
|
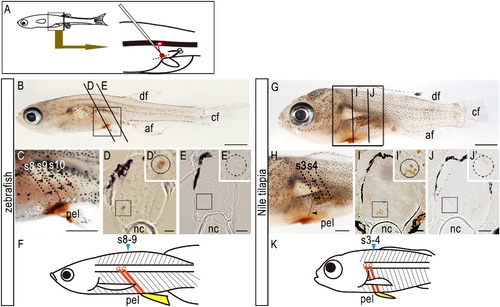
Axial positions of the spinal cord and pelvic fins in zebrafish and Nile tilapia. (A) Biotin-conjugated dextrans were injected into the proximal region of the pelvic fins to label motoneurons (see Materials and methods). (B-F) Zebrafish. (G-K) Nile tilapia. (B-E, G-J) Patterns of motoneurons that innervate the pelvic fin muscles in (B-E) zebrafish larvae and in (G-J) Nile tilapia larvae. (C, H) Details of labeled motoneurons in (B) and (G), respectively. Note that the biotin-labeled motoneurons innervate the pelvic fin (arrowheads). (D, E) Sections of the spinal cord opposite 8th-9th (D) and 10th (E) segments of zebrafish indicated in (B). (I, J) Sections of the spinal cord opposite 3rd and 4th (I) and 5th (J) segments of Nile tilapia indicated in (G). Each inset in (D), (E), (I) and (J) shows a higher magnification of the boxed area in each panel. Cell bodies connected into the pelvic fins are seen in the spinal cord lying above the pelvic fins (insets in D and I) but not in the posterior spinal cord (insets in E and J). (F, K) Schematic diagrams of the axial position of the spinal cord and pelvic fins in zebrafish (F) and Nile tilapia larvae (K). Motoneurons lying above the pelvic fins innervate the pelvic muscles. Somites/segments adjacent to the pelvic fins at the fin bud stage are indicated in blue. af, anal fin; df, dorsal fin; cf, caudal fin; nc, notochord; pec, pectoral fin; pel, pelvic fin. Scale bars: 1.0 mm for panels (B), (C), (G), and (H); 50 μm for panels (D), (E), (I), and (J). |
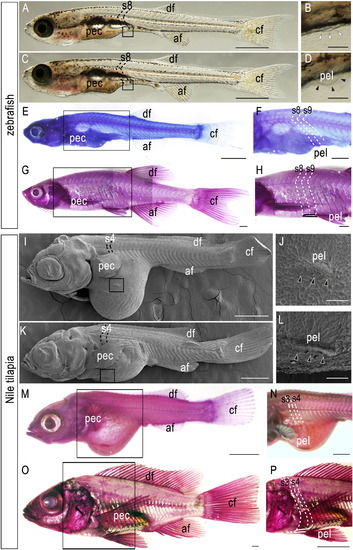
Development of pelvic fins of zebrafish and Nile tilapia. (A-H) Zebrafish larvae (A-F) and adult (G–H). (A) 8.1-mm TL (total length). (B) Detail of pelvic fin region in (A), showing no evidence of pelvic fin bud (open arrowheads). (C) 8.8-mm TL. (D) Detail of pelvic fin region in (C), showing pelvic fin bud outgrowth in the abdominal position (arrowheads). (E-H) Hematoxylin-stained zebrafish larvae (9.0 mm TL; E, F) and adult (29 mm TL; G, H). (F, H) Details of pelvic fin region in (E) and (G), respectively. Note that pelvic fin muscles (outlined) are attached to the 8th-9th segments. (I-P) Nile tilapia larvae (I-N) and adult (O-P). (I-L) Scanning micrographs of Nile tilapia larvae. (I) Stage 22, 9 dpf. (J) Details of pelvic fin region in (I). (K) Stage 25, 11 dpf. (L) Details of pelvic fin region in (K). (M-P) Hematoxylin-stained Nile tilapia larvae (10 dpf; M-N) and adult (5 months post-fertilization; O-P). (N, P) Details of pelvic fin region in (M) and (O), respectively. Note that pelvic fin muscles (outlined) are attached to the 3rd-4th segments. Arrowheads indicate developing pelvic fin bud. Numbers in the panels indicate the segmental order. Note that larval pelvic fin buds appear in the prospective position of pelvic fins. af, anal fin; df, dorsal fin; cf, caudal fin; pec, pectoral fin; pel, pelvic fin. Scale bars: 1.0 mm for panels (A), (C), (E), (G), (I), (K), (M), and (O); 100 μm for panels (B), (D), (J), and (L); 500 μm for panels (F), (H), and (N); 1.0 cm for a panel (P). |
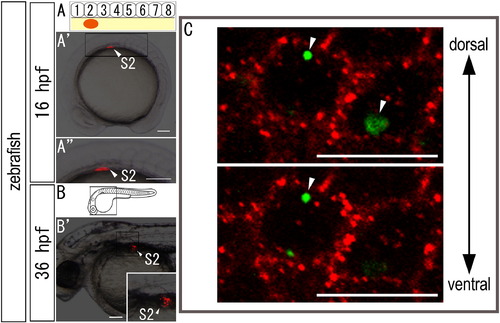
Cell lineage analysis in zebrafish embryos. (A-B) Locations of DiI-labeled cells (A) are indicated by arrowheads. (A) Schematic diagrams showing the locations at which DiI (red) was applied. (A′) DiI was applied to the lateral plate mesoderm cells opposite somite 2 (A′) in 16 hpf zebrafish embryos. (A3, B′) Higher magnification of the labeled regions shown in (A′) and (B), respectively. (C) Intracellular localization of aggregated Qdot granules in the cytoplasm. Confocal micrographs were obtained through the mesodermal cells labeled with Qtracker. Embryos were stained with anti-β-catenin antibody, a marker of the membrane (Nagafuchi, A., 2001. Molecular architecture of adherens junctions. Curr Opin Cell Biol. 13, 600-3). Note that the aggregated Qdot nanocrystals are delivered to the intracellular domains (arrowheads) of mesodermal cells. Scale bars: 100 μm for panels (A) and (B); 5 μm for a panel (C). |
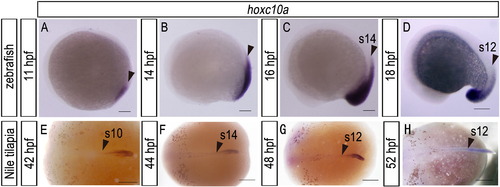
Expression pattern of hoxc10a in zebrafish and Nile tilapia embryos. (A-D) Zebrafish embryos at the times indicated. (E-H) Nile tilapia embryos at the times indicated. Arrowheads indicate the anterior border of hoxc10a expression. Scale bars: 100 μm for panels (A), (B), (C), and (D); 500 μm for panels (E), (F), (G), and (H). |
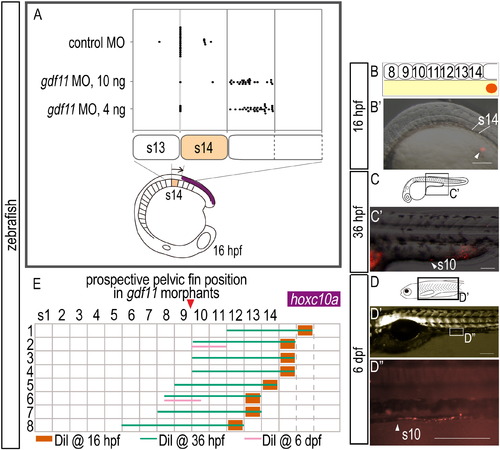
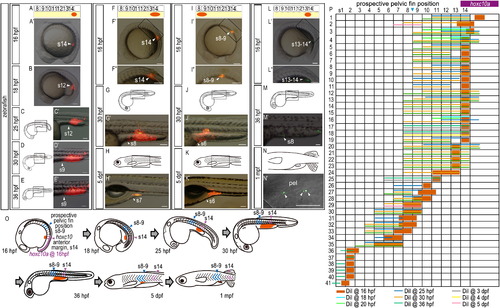
Expression of hoxc10a and DiI-labeling in zebrafish embryos injected with gdf11 MO. (A) Measurement of the anterior border of hoxc10a expression in the spinal cord in gdf11 morphants. Note that the anterior border of hoxc10a expression was in somite 15 in most gdf11 morphants (26/27 in 100ng gdf11 morphants; 29/35 in 40ng gdf11 morphants). (B-D) Cell lineage analysis in gdf11 morphants. Locations of DiI-labeled cells are indicated by arrowheads. (B) Schematic diagram showing the location of DiI (red) application. (B′) DiI was applied to the lateral plate mesoderm cells opposite somite 15 in 16 hpf zebrafish gdf11 morphants. (C, D) Schematic diagrams of zebrafish embryos at 36 hpf (C) and 6 dpf (D). (C′, D′) Higher magnification of the labeled regions shown in (C) and (D), respectively. Scale bars: 100 μm. (E) Cell lineage analysis in zebrafish gdf11 morphants. Numbers above each column indicate the opposite somite levels. The purple bar indicates hoxc10a expression in the spinal cord at 16 hpf of gdf11 morphants. Sample numbers are shown at left. Note that the DiI-labeled cells within somite 15, where the anterior border of hoxc10a expression is observed in the spinal cord of gdf11 morphants at 16 hpf, were identified in the pelvic fin position of gdf11 morphants (somite 9-10 levels) by 36 hpf, and continued to be in the same position at 6 dpf. |
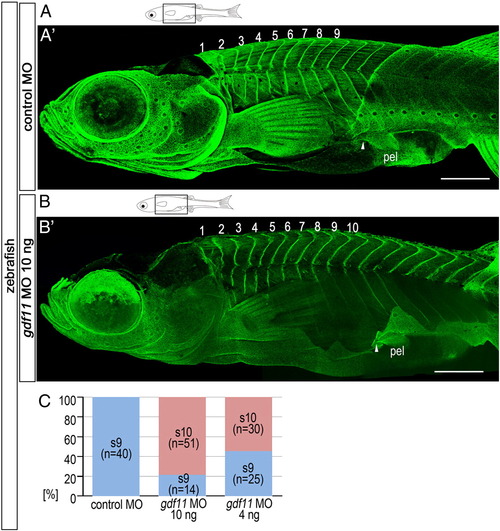
Caudal shift in pelvic fins observed in embryos injected with gdf11 MO. (A, B) Schematic diagrams of zebrafish larvae at 6 wpf. Zebrafish morphants were injected with 5 ng control MO (A) or 10 ng gdf11 MO (B). (A′, B′) Confocal micrographs of morphants labeled with anti-paxillin to visualize the different segments. Numbers in the panels indicate the segmental order. Note that prospective pelvic fin muscle regions (anterior regions of fins) of gdf11 morphants are attached to the 10th segment (white arrowhead in A′), while those of control morphants are attached to the 9th segment (white arrowhead in B′). (C) Percentages of larvae with pelvic fins at the somite 9 or 10 level following injection of 5 ng control MO, 10 ng gdf11 MO, or 4 ng gdf11 MO. pel, pelvic fin. Scale bars: 500 μm for panels (A) and (B). PHENOTYPE:
|
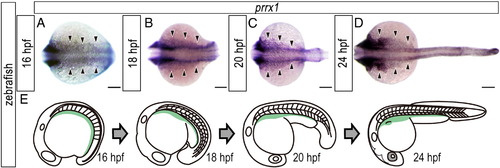
Distribution of lateral plate mesoderm cells during trunk–tail protrusion in zebrafish embryos. (A-D) Expression pattern of prrx1 in developing zebrafish embryos. (A) 16 hpf. (B) 18 hpf. (C) 20 hpf. (D) 24 hpf. Dorsal view. Arrowheads indicate the prrx1-positive lateral plate mesodermal cells. (E) Schematic diagrams showing the expression pattern of prrx1 (light green) on the yolk of developing zebrafish embryos. Note that the caudal region of the prrx1-positive area narrowed when the trunk-tail protruded from the yolk. Scale bars: 100 μm. |
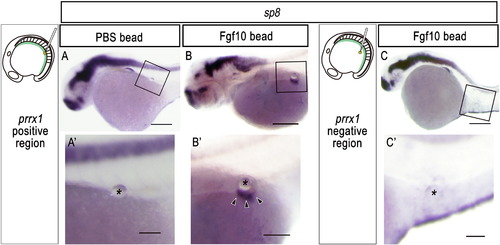
Ectopic pelvic fin-like structures are induced after implantation of an Fgf10-soaked bead into the prrx1-positive lateral plate mesoderm. (A-C) Expression of sp8, a marker for fins, in zebrafish embryos implanted with an Fgf10-soaked bead (B, C) or a PBS-soaked bead (A) in the prrx1-positive region (A, B) or in the prrx1-negative region (C) at 16 hpf (see also Materials and methods). (A′, B′, C′′) Details of the boxed regions in (A), (B) and (C), respectively. The bead is indicated by an asterisk. Arrowheads indicate ectopic sp8 expression in the induced fin-like structure (B′). Note the ectopic fin bud-like structure that formed in the body wall of zebrafish embryos implanted with an FGF-soaked bead, but not with a PBS-soaked bead, in the prrx1-positive region (A, B). However, an FGF-soaked bead implanted in the prrx1-negative region did not elicit sp8 expression (C). Ectopic sp8 expression was observed only on the line extending from the ridge of pectoral fin buds despite the position of the implanted bead (B′), suggesting that ectopic apical ridges might have been induced only in the dorsoventral boundary of the ectoderm. Scale bars: 100 μm for panels (A-C); 50 μm for panels (A′-C′). |
Reprinted from Developmental Biology, 347(1), Murata, Y., Tamura, M., Aita, Y., Fujimura, K., Murakami, Y., Okabe, M., Okada, N., and Tanaka, M., Allometric growth of the trunk leads to the rostral shift of the pelvic fin in teleost fishes, 236-245, Copyright (2010) with permission from Elsevier. Full text @ Dev. Biol.