
- Title
-
In vivo magnetic resonance imaging to detect malignant melanoma in adult zebrafish
- Authors
- Kabli, S., He, S., Spaink, H.P., Hurlstone, A., Jagalska, E.S., De Groot, H.J., and Alia, A.
- Source
- Full text @ Zebrafish
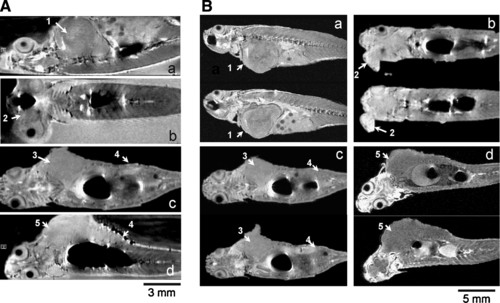
Noninvasive detection of malignant tumors in transgenic mitf:Ras::mitf:GFP X p53-/- zebrafish using magnetic resonance microimaging (μMRI). Images of living (A) and freshly killed (B) adult transgenic zebrafish showing presence of tumor at various locations (a–d) in different zebrafish. Malignant tumor seen in (1) trunk muscles and abdomen that is penetrating into myoseptum; (2) near eye; (3) back muscles; (4) intestine; and (5) back muscle penetrating into liver and intestine. |
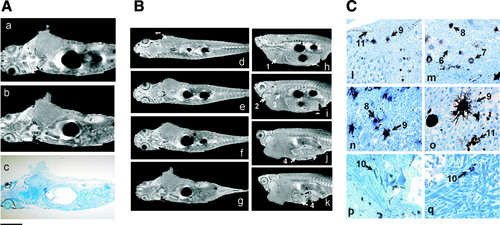
Characterization of malignant tumor in transgenic mitf:Ras::mitf:GFP X p53-/- zebrafish. (A) Comparison of images of same transgenic zebrafish, with large abdominal tumor, obtained by (a) in vivo μMRI, (b) ex vivo μMRI, and (c) after histological sectioning. (B) Successive (μMRI slices in coronal (d–g) and sagittal (h–k) planes of freshly killed adult transgenic zebrafish showing abdominal tumor (1) location and its penetration in various locations such as heart (2), liver (3), and intestine (4). (C) (l–q) High-magnification view of tumor showing its heterogeneity and cell morphology. Different stages of melanocyte differentiation are clearly visible, for example, precursor cells (6) and immature (7), mature (8), and dendritic (9) melanocytes. The penetration of melanocytes in muscle cells (10) and melanin vesicles produced by melanocytes (11) are clearly visible. Scale bars (10 mm): 2 mm in (a–c), 5 mm in (d–k), 300 μm in (l, m, q), 250 μm in (n, o), 1 mm in (p). Color images available online at www.liebertonline.com/zeb. |
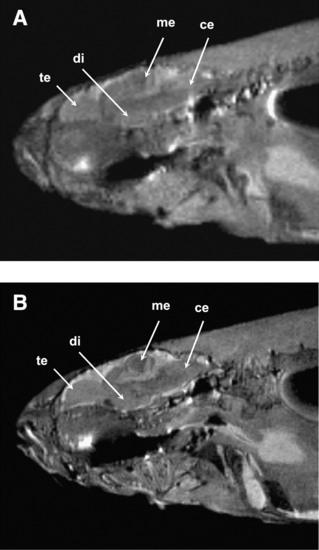
High-resolution images of adult zebrafish at a magnetic field strength of 9.4 T (A) and 17.6 T (B). Slices in sagittal plane were obtained using the rapid acquisition with relaxation enhancement pulse sequence (echo time [TE], 15 ms with effective TE, 33.6 ms; repetition time, 2000 ms; number of scan, 4; total scan time, 8 min). The image resolution is 78 (m and slice thickness is 0.2 mm. Signal-to-noise ratio at 9.4 and 17.6 T was calculated to be 18 and 32, respectively. Image quality improvement is clearly visible at 17.6 T, as many substructures in the brain (e.g., te, telencephalon; di, diencephalon; me, mesencephalon; ce, cerebellum) that were not visible at 9.4 T can be clearly seen at 17.6 T. |
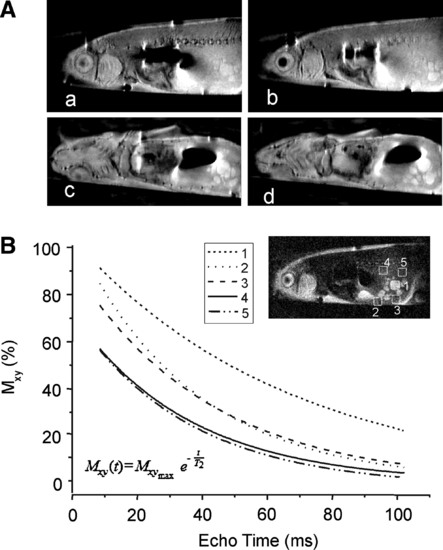
In vivo characterization of malignant abdominal tumor in transgenic zebrafish using in vivo (MRI at 17.6 T. (A) (MRI slices in coronal (a, b) and sagittal (c, d) planes of living transgenic zebrafish clearly showing the heterogeneity of abdominal tumor. (B) T2 relaxation time measurement of specific regions within (1–3) and outside (4 and 5) tumor as calculated from the plot of TE versus T2 contrast (magnetization present in x–y plane, Mxy) by applying the equation as shown at the bottom of the curve. T2 relaxation times in regions 1, 2, 3, 4, and 5 were 66.3 ± 4, 36.7 ± 2.5, 42.3 ± 1.3, 35.9 ± 1.8, and 33.4 ± 2.6 ms, respectively. |
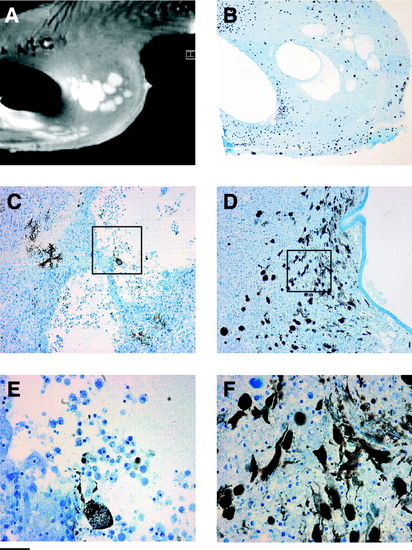
Heterogeneity of the malignant abdominal tumor in transgenic zebrafish observed by (A) (MRI at 17.6 T and (B–F) after histological sectioning. Scale bars: 0.5 mm in (A, B); 0.05 mm (C, D). (E) and (F) are magnified subsampled insets of (C) and (D), respectively. Color images available online at www.liebertonline.com/zeb. |