
- Title
-
Multispectral four-dimensional imaging reveals that evoked activity modulates peripheral arborization and the selection of plane-polarized targets by sensory neurons
- Authors
- Faucherre, A., Baudoin, J.P., Pujol-Martí, J., and Lopez-Schier, H.
- Source
- Full text @ Development
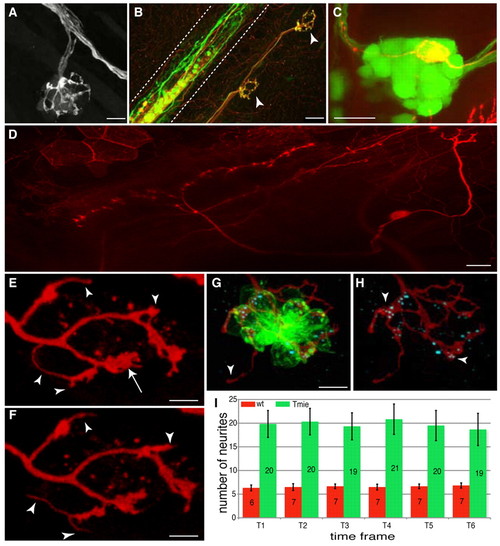
Central and peripheral projections of lateralis afferent neurons. (A) GFP-positive peripheral projections in the HGn39D transgenic zebrafish line. Three afferent neurons projecting to a neuromast are depicted. (B) Neuromast innervation in a HuC:Kaede and islet1:gfp double-transgenic larva after Kaede photoconversion. Green neurons are GFP positive, red neurons are Kaede positive and yellow neurons are GFP/Kaede positive. Neuromasts are innervated by both red and yellow neurons. Arrowheads indicate the neuromasts. Dashed lines delimit the spinal cord. (C) Soma of a single TdTomato-positive afferent neuron in a GFP-positive posterior ganglion of an HGn39D transgenic fish. The soma expressing TdTomato is localized in the posterior lateral line ganglion. (D) Central projection of a single TdTomato-labeled afferent neuron. Anterior is to the left and posterior to the right. (E,F) Peripheral projections of a single TdTomato-labeled afferent neuron at two different time frames (10-minute interval). The arrow indicates a bulged extremity, whereas the arrowheads indicate thin and mobile neurites. (G,H) Anti-Ribeye B immunostaining. The formation of ribbon synapses between the afferent neuron (red) and the hair cells (green) is visualized by the presence of the Ribeye B protein (cyan). Arrowheads indicate (G) a thin neurite that does not contact a hair cell, and (H) bulged neurites containing the Ribeye B protein. (I) The average number of neurites present at each time point for wild-type (wt) and tmie mutant fish. Error bars represent the s.e.m. Wild type, n=6; tmie, n=6. Scale bars: 10 μm in A,G,H; 20 μm in B-D; 5 μm in E,F. |
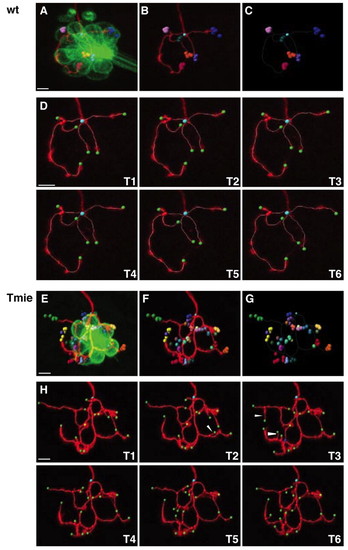
Four-dimensional reconstruction of a single labeled afferent neuron. (A-G) Four-dimensional representations of an afferent neuron in wild-type (A-C) and tmie mutant (E-G) fish. (A,E) mem-TdTomato-labeled neuron contacting the GFP-expressing hair cells. The terminal point of each neuron has been plotted with a different color. For each terminal point (i.e. for each color) positions have been plotted over time, every 10 minutes for 1 hour. (B,F) Same as A,E but without the hair cells. (C,G) Same as B,F but with only the dots representing the terminal point. The unique cyan dot indicates the beginning point of the neuronal arbor. The white frame corresponds to the neuronal arbor reconstruction of the first time frame. (D,H) Maximal projections and neuronal arbor reconstruction of the same neuron over time. Images T1-T6 were taken every 10 minutes for 1 hour. Beginning point is in cyan, terminal points are in green, branching points are in red, and special branching points (multiple bifurcations) are in blue. Arrowheads indicate examples of transient neurites. Scale bars: 5 μm. |
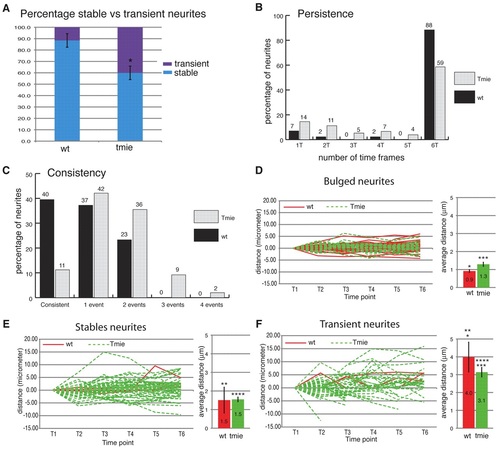
Quantitative analysis of neurite dynamics. (A) Average of stable (present throughout the six time frames) versus transient (present in fewer than six time frames) neurites in wild-type and tmie mutant fish. Error bars represent the s.e.m. *, P<0.01. (B) Neurite persistence. Persistence of neurites was calculated from the percentage of neurites present for only one, two, three, four, five or all six time frames. (C) Neurite consistency. ‘Consistent’ refers to a neurite that has neither grown nor retracted over the six time frames. ‘One event’ refers to a neurite that has only grown or retracted over the six time frames. ‘Two events’ refers to a neurite that completed a sequence of two counter movements, i.e. growth followed by retraction or vice versa. Similarly, ‘three events’ refers to a sequence of three counter movements. (D-F) Dynamics of neurites tips. The value of the terminal point position at the first time point was normalized to zero and the same value was subtracted from the subsequent time points in order to establish the distance traveled by the neurite tip. On the right of each graph is shown the average distance (µm) traveled by each type of neurite during one time frame. Stable neurites lack a bulged extremity but are present throughout the six time frames. (D) Dynamics of bulged neurites. (E) Dynamics of stable non-bulged neurites. (F) Dynamics of transient neurites. Red lines, wild type; dashed green lines, tmie. Error bars represent s.e.m. *, ***, ****, P<0.01; **, P<0.1 for pairs indicated by number of asterisks; wild type, n=6; tmie, n=6. PHENOTYPE:
|
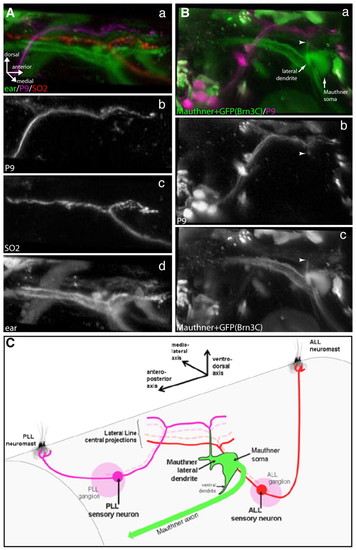
Central projections of first-order lateral line sensory neurons in tmie mutants. Central somatotopy and targeting of the Mauthner cell are conserved in tmie mutants. (Aa-d) Fluorescent dextran injections in tmie-/- brn3c:gfp transgenic fish showing somatotopy of first-order lateral line sensory neuron projections coming from posterior (b) and anterior (c) neuromasts. Projections coming from P9 (PLL) neuromasts (b; Alexa 647-dextran) and SO2 (ALL) neuromasts (c; Rhodamine-dextran) project in a dorsoventral manner (a) in the hindbrain. (d) Projections coming from the ear (Brn3c:GFP). (Ba-c) Fluorescent dextran injections in tmie-/- brn3c:gfp transgenic fish showing central targeting of the Mauthner lateral dendrite by posterior and anterior lateral line projections (a). Projections coming from the P9 (PLL) neuromast (b; Alexa 647-dextran) connect (arrowheads) to the lateral-most portion of the Mauthner cell lateral dendrite (c; fluorescein-dextran), which extends ventrodorsally. (C) Scheme (not to scale) depicting the central somatotopy of the first-order lateral line sensory neuron projections, and their targeting of the Mauthner cell lateral dendrite. In tmie fish, the anteroposterior axis of the lateral line neuromast projects onto the ventrodorsal axis of the Mauthner lateral dendrite dorsal projection, as in wild-type fish. ALL, anterior lateral line; PLL, posterior lateral line. EXPRESSION / LABELING:
|
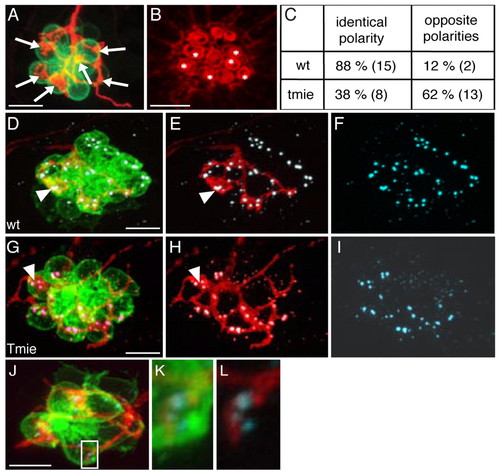
Afferent neurons from tmie mutants are not strict polarity selectors. (A-C) Analysis of polarity-specific innervation in HuC:mem-TdTomato-injected brn3c:gfp tmie mutants. (A) Maximal projection and (B) phalloidin staining of a neuromast innervated by a single labeled afferent neuron in a tmie mutant. Arrows in A indicate bulged neurites establishing contacts with the hair cells. Asterisks in B indicate the innervated hair cells. (C) The percentage of contacts established between an afferent neuron and hair cells of identical polarity or hair cells of two opposing polarities. The numbers in brackets indicate the number of neuromasts (wild type, n=17; tmie, n=21). (D-L) Immunodetection of ribbon synapses in wild type (D-F) and tmie (G-L) fish using the Ribeye B antibody (cyan). Bulged contacts of afferent neurons expressing TdTomato (red) with hair cells (green) are associated with the presence of synapses in wild type (D-F) and tmie (G-I) fish (arrowheads indicate an example in each case). Thin neurites can also form synapses with hair cells as shown by the presence of Ribeye B staining in the neuromast of a tmie mutant (J-L). The boxed area in J is magnified in K,L. Scale bars: 10 μm in A,D,G,J; 5 μm in B. EXPRESSION / LABELING:
|
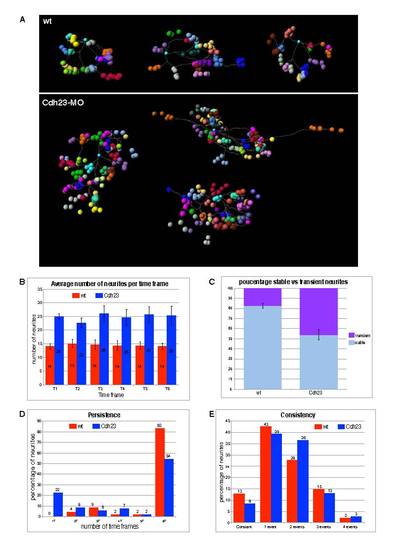
Four-dimensional representations of single labeled afferent neurons and quantitative analysis of neurite dynamics. (A) Four-dimensional representations of single labeled afferent neurons in three wild-type fish (above) and three Cdh23 morphants (below). Each neuron terminal point has been plotted with a different color. For each terminal point (i.e. for each color) positions have been plotted over time, every 10 minutes for 1 hour. (B-E) Quantitative analysis of neurite dynamics. (B) Average number of neurites present at each time point for wild-type fish and Cdh23 morphants. (C) Average of stable (present throughout the six time frames) versus transient (present in fewer than six time frames) neurites in wild-type fish and Cdh23 morphants. Error bars represent the s.e.m. (D) Neurite persistence. Persistence of the neurites was calculated by counting the percentage of neurites present for only one, two, three, four, five or all six time frames. (E) Neurite consistency. ′Consistent′ refers to a neurite that has neither grown nor retracted over the six time frames. ′One event′ refers to a neurite that has only grown or only retracted over the six time frames. ′Two events′ refers to a neurite that completed a sequence of two counter movements, i.e. growth followed by retraction or vice versa. Similarly, ′three events′ refers to a sequence of three counter movements; for example, growth followed by retraction followed by growth. Wild type, n=3; Cdh23, n=3. PHENOTYPE:
|