
- Title
-
Genetic analysis of fin development in zebrafish identifies furin and hemicentin1 as potential novel Fraser Syndrome disease genes
- Authors
- Carney, T.J., Feitosa, N.M., Sonntag, C., Slanchev, K., Kluger, J., Kiyozumi, D., Gebauer, J.M., Coffin Talbot, J., Kimmel, C.B., Sekiguchi, K., Wagener, R., Schwarz, H., Ingham, P.W., and Hammerschmidt, M.
- Source
- Full text @ PLoS Genet.
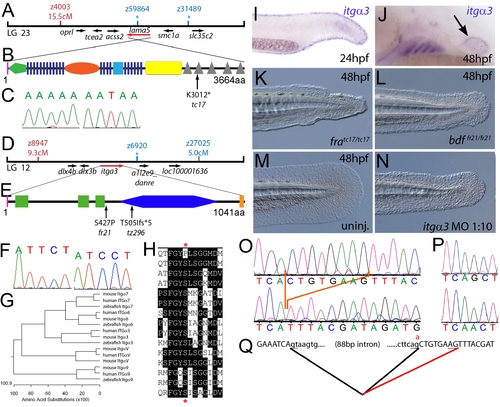
The fin dysmorphogenesis of fransen and badfin mutants are caused by mutations in Lamininα5 and Integrinα3 subunits. (A) Linkage analysis localised the fransen locus to LG23 close to the SSLP marker z59864, a region containing the lama5 gene. Here and in subsequent figures, all markers north of the locus are represented in red, whilst those south in blue. Approximate genetic distances of markers relative to the mutated locus (in centi Morgan), calculated by Kosambi′s mapping function, are given below each marker, with non-recombining markers indicated by an asterisk. Location and relative orientation of candidate genes residing in the interval are depicted below the map as arrows, with the affected gene coloured red. (B) Schematic of Lamininα5 protein showing the domains of the protein, namely the signal peptide (pink bar), a laminin N-terminal domain (green pentagon), laminin-type EGF-like domains (dark blue bars), an LF-like domain (orange oval), a laminin B domain (light blue box), a coiled-coil domain (yellow box) and 5 laminin G domains (grey triangles). The location and molecular nature of the fransentc17 mutation is given below. (C) Sequence chromatograms of lama5 cDNA from fratc17/tc17 mutant (right panel) and WT sibling (left panel). (D) Linkage analysis localised the bdffr21/fr21 mutant to LG 12, near z6920. Candidate genes in the region were tested and itga3 was further characterised. (E) Protein schematic of Itgα3 protein showing the signal peptide (pink bar), 3 Integrin β-propellers (green boxes), an Integrin alpha domain (blue hexagon) and a transmembrane domain (orange bar). The location and details of the bdffr21 and bdftz296 molecular lesions are given. (F) Sequence chromatograms of itga3 cDNA from bdffr21/fr21 mutant (right panel) and WT sibling (left panel). (G) Phylogenetic tree of 5 different Integrin proteins from human, mouse and zebrafish showing that the integrin mutated in bdf is a true Itgα3 orthologue. (H) Protein ClustalW alignment showing that the bdffr21 mutation occurs in a residue (red asterisks) conserved across multiple Integrins in disparate vertebrates. Sequences are from top, zebrafish Itgα3 from bdffr21/fr21 mutant, wild-type zebrafish Itgα3, human Itgα3, mouse Itgα3, human ItgαV, mouse ItgαV, zebrafish ItgαV, human Itgα6, mouse Itgα6, zebrafish Itgα6, human Itgα7, mouse Itgα7, human Itgα9, mouse Itgα9, zebrafish Itgα7. (I–J) Lateral views of embryos stained by in situ hybridisation with a probe for itga3 showing expression in the medial fin fold at 24 hpf (I) and in the pectoral fin (arrow) at 48 hpf along with expression in the branchial arches and neuromasts (J). (K–N) Lateral Normaski images of the medial fin of a fratc17/tc17 embryo (K), a bdffr21/fr21 embryo (L), or an embryo injected with a MO targeting the translation start of the itga3 mRNA at 48 hpf (N). The itga3 morphant displays moderate dysmorphogenesis of the fin, highly reminiscent of the bdffr21/fr21 mutant at this stage and in contrast to uninjected control (M). (O–Q) Sequence chromatograms of itga3 cDNA of bdftz296/tz296 mutant (O; lower panel), and WT sibling (O; upper panel), showing the deletion of 8 nucleotides in the mutant cDNA, and of itga3 genomic DNA of bdftz296/tz296 mutant (P; lower panel) and WT sibling (P; upper panel), showing the mutation of the splice acceptor site. (Q) illustrates altered splicing at the exon 10 — exon 11 junction in bdftz296/tz296 mutant compared to WT sibling. Here and in subsequent figures, normal splicing is shown as black lines joining the exon sequences (represented in uppercase). The intron sequences are in lowercase with the normal or cryptic splice donor and acceptor sites underlined. The substituted base is shown in red above the WT base, with the mutated splice acceptor generating aberrant splicing with use of a cryptic splice acceptor (illustrated as a red line). |

The fin blistering of pinfin mutants is caused by mutations in Fras1. (A–C) Injection of a morpholino targeting the translation site of fras1 mRNA into wild-type embryos phenocopies the pif fin blisters; lateral views of tip of tail at 48 hpf; (A) uninjected control; (B) pifte262/te262 mutant; (C) fras1 morphant. (D) Linkage analysis localised the pinfin locus to linkage group 5, close to the SSLP markers z6981 and z8122, neither of which recombined with the locus, and between which the fras1 gene (depicted in red) was located. (E–H) Images of embryos stained by in situ hybridisation using a probe against fras1. Close up view of the tail region of a 24 hpf embryo (E) and a 48 hpf embryo (F) are shown. The fras1 gene is expressed in the medial fin fold, the pectoral fin fold (arrow in F; also see inset), the pronephric ducts (filled arrowhead in E) and the otic vesicle (asterisks in F and insert). fras1 expression is also noted in the midbrain-hindbrain region at 24 hpf and 48 hpf (open arrowhead in G and F) and in the pharyngeal pouches of the arches (H). (E–G) show lateral views, (H) a dorsal view. (I) Schematic of the predicted domain structure of zebrafish Fras1 protein, with a signal peptide (pink bar), von Willebrand C domains (green triangle), furin-like domains (red ovals), CSPG domains (orange diamonds), Calx-bdomains (blue boxes) and a transmembrane domain (orange bar). Lesions found in four pif alleles are indicated above the protein schematic. (J,L,M,O) Sequence chromatograms of fras1 cDNA from pifte262/te262 (J), pifb1130/b1130 (L), pifb1048/b1048 (O), and piftm95/tm95 (M) mutants, displaying the lesions depicted in (I). The frame shift (fs) mutation in pifte262 is due to the insertion of the last 10 nucleotides of intron 42 (delineated with orange lines). In all panels, the WT sibling chromatogram is given above the mutant chromatogram. (K) Chromatograms showing the genomic sequence at the end of intron 42 of the fras1 gene in pifte262/te262 (lower panel) and WT sibling (upper panel) embryos. The A>G substitution generates a novel splice acceptor. (N) Representation of the exon 42-exon 43 junction with the mutation generating aberrant splicing (red line). (P) The glycine residue (red asterisks) substituted in piftm95/tm95 is strictly conserved in both Fras1 and Frem2 proteins across diverse phyla, as seen in an alignment of the region. Protein sequences are from top: zebrafish piftm95/tm95 mutant Fras1; zebrafish wild-type Fras1; fugu Fras1; human FRAS1; mouse Fras1; dog Fras1; cow Fras1; chicken Fras1; sea urchin ECM3; zebrafish Frem2a; fugu Frem2a; human FREM2. |
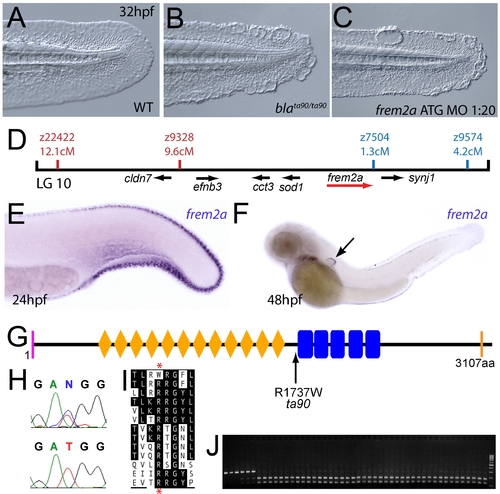
The fin blistering of the blasen mutant is caused by mutation of Frem2a. (A–C) Injection of a morpholino targeting the translation site of frem2a mRNA into WT embryos phenocopies the bla fin blisters; lateral views of posterior medial fin, 48 hpf; (A) uninjected control; (B) blata90/ta90 mutant; (C) frem2a morphant. (D) Genetic map (set out as in Figure 1A), showing the approximate location of the blasen locus on linkage group 10 between markers z9328 and z7504, with genes within this interval shown below, including the strong candidate frem2a (red arrow). (E,F) Lateral views of embryos at 24 hpf (E) and 48 hpf (F) stained by in situ hybridisation for frem2a, revealing expression in the medial and pectoral fin fold (arrow, F). (G) Schematic of the zebrafish Frem2a protein with conserved domains as in Figure 2I, and the position and nature of the blata90 mutation indicated. (H) Sequence chromatograms of frem2a cDNA from blata90/ta90 mutants (lower panel) and heterozygous siblings (upper panel) showing the missense mutation depicted in (G). (I) Protein sequence alignment of Fras and Frem proteins showing the absolute conservation of the arginine residue mutated in blata90 (red asterisks) across different vertebrate classes. Sequences from the top are: zebrafish blata90/ta90 mutant Frem2a; zebrafish wild-type Frem2a; zebrafish Frem2b; zebrafish Frem3; human FREM2; mouse Frem2; zebrafish Fras1; fugu Fras1; human FRAS1; mouse Fras1; zebrafish Frem1a; human FREM1; mouse Frem1. (J) Segregation linkage analysis: the blata90 mutation generates a BccI site, which is present in both alleles of all bla homozygotes (lanes 7–48), whilst wild-type siblings (lanes 1–6) show at least one copy of the uncut allele; lane 49, 100 bp ladder. |

The fin blistering of rafels mutants is caused by mutations in Frem1a, which shows partial functional redundancy with Frem1b. (A–C) The rafels mutant displays mild blistering of the posterior fin at 48 hpf (B) compared to a sibling (A), and is phenocopied in wild-type embryos by injection of a morpholino targeting frem1a (C). Lower panels show dorsal views tail fin, providing a more striking image of the blistering in the mutant and morphant. (D,E) Expression of frem1a in the medial fin fold at 24 hpf (D) and pectoral fin at 48 hpf (D-inset). Expression of frem1b is weaker but can be seen in the tail region, in particular in the blood islands, at 24 hpf (E). (F) Genetic map (set out as in Figure 1A), showing the approximate location of the rafels locus on linkage group 7 between markers z9249 and z13880. Independent radiation hybrid mapping localised the frem1a gene to this region, with distances to the mapping markers given in grey. (G) Schematic of the zebrafish Frem1a protein with conserved domains as defined in Figure 2I. The purple circle depicts the C-type Lectin domain. The positions and natures of the molecular lesions of the rfltc280b, rflfr23 and the rfltr240 alleles are indicated. (H–L) Sequence chromatograms of the mutations in the frem1a cDNA of rfltc280b/tc280b (H), rflfr23/fr23 (I), and rfltr240/tr240 (J) (lower panels) compared to wild-type siblings (upper panels). The 13 nucleotide insertion in the rfltr240/tr240 allele is delineated by orange lines (J). Genomic sequencing of the intron32-exon33 boundary reveals generation of a novel splice site in the rfltr240/tr240 mutants (K; lower chromatogram), leading to aberrant splicing as depicted in (L) (red lines). (M–P) frem1b splice MO enhances the rafels phenotype. Lateral views of WT (M) or rflfr23/fr23 (N–P) embryos either uninjected (N) or injected with frem1b splice MO (M,O,P) photographed at 32 hpf (M–O) or 48 hpf (P). Whilst the frem1b MO does not generate a phenotype alone (M), it reveals a blistering phenotype in rafels mutants at 32 hpf (O), a time when a phenotype is not seen in uninjected mutants (N). The frem1b MO injected frem1a mutants often display degeneration of the fin at 48 hpf (P; compare to B). |
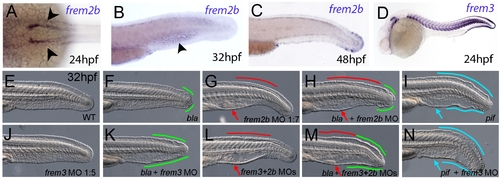
Partially redundant roles of zebrafish Frem2/3 paralogues. In situ hybridisation of embryos using probes against frem2b (A–C), and frem3 (D) at 24 hpf (A, D), 32 hpf (B), and 48 hpf (C). Expression of frem3 in the fin fold can be seen at 24 hpf (D), whilst expression at this site only commences at 48 hpf for frem2b (C). frem2b is also expressed in the blood islands at 32hpf (arrowhead, G) and in the pronephric ducts from 24 hpf (arrowheads in A; dorsal view). (E–N) Lateral views of 32 hpf WT embryos (E,G,J,L), blata90/ta90 embryos (F,H,K,M) or piftm95/tm95 embryos (I,N) which are either uninjected (E,F,I), or injected with morpholinos targeting frem2b (G,H), frem3 (J,K,N) or a mix of morpholinos against frem2b and frem3 (L,M). Blistered regions of the fin and blood islands are highlighted by bars and arrows respectively which are coloured green in bla mutants, red in frem2b morphants and blue in pif mutants. |
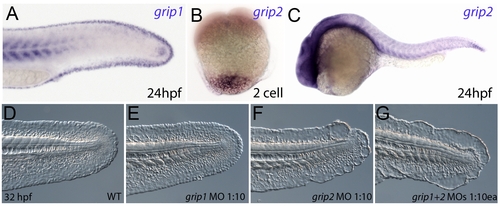
Conserved and redundant roles of zebrafish Grip1/2 proteins. Lateral views of embryos stained by in situ hybridisation with probes against grip1 (A) and grip2 (B,C) at 2-cell stage (B) and 24 hpf (A,C). grip1 is expressed in the fin fold (A) whilst grip2 is broadly expressed at 24 hpf (C). grip2 is maternally deposited in a vegetal domain (B). (D–G) Lateral views of an uninjected WT embryo (D) or embryos injected with morpholinos against grip1 (E), grip2 (F) or both grip1 and grip2 (G) at 32 hpf, demonstrating that whilst grip2 can fully compensate for loss of grip1 function in fin fold integrity (E), loss of grip2 alone (F), or combined loss of both proteins (G) generates moderate to severe fin fold blistering respectively. |
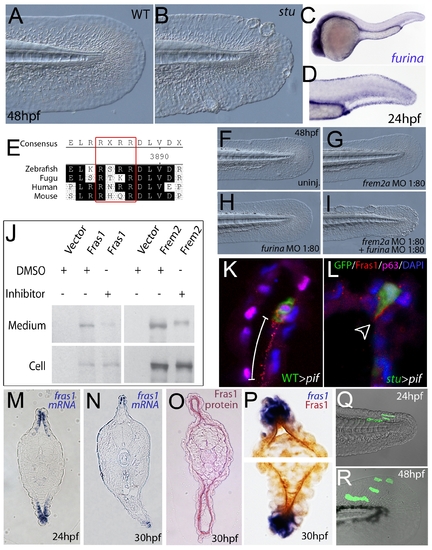
Furin is required for basement membrane anchorage, ectodomain shedding and proper basement membrane localisation of Frem2 and Fras1 proteins. (A,B) Lateral views of the medial fin of a sturgeon mutant at 48 hpf (B) showing mild blistering reminiscent of pinfin and blasen mutants compared to a sibling (A). (C,D) In situ hybridisation analysis of furina demonstrates broad expression in the embryo at 24 hpf (C) with clearly increased levels in the fin fold (D). (E) A consensus Furin cleavage site (red box) is conserved in Fras1 immediately N-terminal to the transmembrane domain across vertebrates. (F–I) furina and frem2a interact dose-dependently in zebrafish. Embryos injected with sub-phenotypic doses of morpholinos targeting frem2a (G) or furina (H) have medial fins as uninjected control embryos (F) at 48 hpf. Combined injection of the two MOs at these doses robustly induces single or multiple blisters of the fins (I). (J) Chemical inhibition of Furin function (far right lanes in all panels) reduces secretion of N-terminally 3xHA tagged Fras1 protein (upper left panel) and of N-terminally 3xMyc tagged Frem2 protein (upper right panel) from 293F cells into the medium. Proteins were detected by Western Blotting with an anti-HA antibody (for the Fras1 construct) or an anti-myc antibody (for the Frem2 construct). Cellular expression levels were not affected by addition of the inhibitor (lower panels). Due to the large size of the proteins and the small size of the cleaved C-terminus, the differences in sizes between the cellular and secreted proteins are indistinguishable. (K,L) Transverse sections of the posterior medial fin of 42 hpf pifte262/te262 embryos at 42 hpf, after transplantation of GFP-positive cells from either a WT (K) or a sturgeon mutant (L) donor at 6 hpf. The sections were immunostained for Fras1 (red), p63 (pink) and GFP (green), and nuclear DNA was counterstained with DAPI (blue). Fras1 protein from WT cells can be found in the basement membrane several cell diameters proximal of its source (white bar in K). In contrast, Fras1 from stu mutant cells lacking FurinA remains restricted to the basal surface of the donor cell (arrowhead, L). (M–P) Transverse sections through tail of embryos at 24 hpf (M) or 30 hpf (N–P) showing localisation of fras1 mRNA by in situ hybridisation (M,N,P: blue precipitate) compared to Fras1 protein (O: red precipitate, P: brown precipitate). Fras1 protein is present in the basement membrane along the entire fin fold (O,P), whereas fras1 mRNA is largely restricted to apical cells of the fin fold (M,N,P). Apical restriction is more pronounced at 30 hpf (N), while at 24 hpf, the fras1 expression domain appears to extend further proximally (M). (Q,R) Cell tracing analysis after transplantation of GFP-labelled, tg(bactin::hras-egfp) transgenic presumptive epidermal cells into non-transgenic hosts. Comparison of labelled cells in the same chimeric embryos at 24 hpf (Q) and 48 hpf (R) revealed that proximal clones had approximately doubled their cell number, whilst distal cells had not proliferated, but had increased their surface area by acquiring a flat elongate shape. |
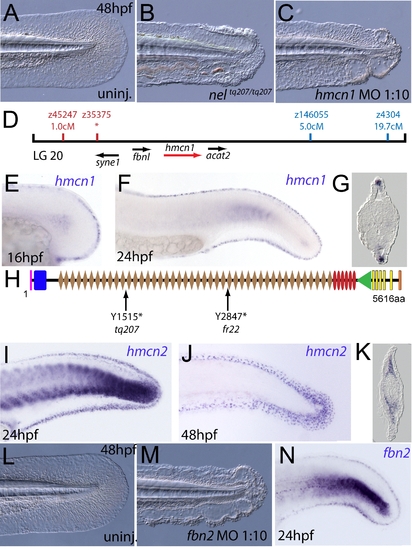
The fin blistering of nagel mutants is due to mutations in the hemicentin1 gene. (A–C) Lateral views of the posterior medial tail fin of WT larvae at 48 hpf injected with a morpholino targeting the translation site of hmcn1 mRNA (C). Blisters reminiscent of nagel mutant embryos (B) are clearly visible compared to age-matched uninjected controls (A). (D) Genetic map showing the location of the nagel locus on LG20, which did not recombine with the SSLP marker z35375. The genes within the interval, including hmcn1 (red arrow), are shown below. (E–G) Lateral views (E,F) and transverse section (G) of embryos stained by in situ hybridisation with an hmcn1 probe, showing expression in somites (F) and in the apical region of the fin fold at 16 hpf (E), 24 hpf (F), and at 48 hpf (G). (H) The zebrafish Hmcn1 protein is 5616 amino acids in length and contains a signal peptide (pink bar), a Von Willebrand factorA domain (blue box), 44 Ig-like domains (brown diamonds), six thrombospondin type-1 repeats (red ovals), a nidogen G2 domain (green triangle), five EGF-like domains (yellow bars) and a Neuralized homology repeat domain (orange bar). Mutations of the two sequenced nagel alleles and their relative locations are indicated. (I–K) Lateral views (I,J) and transverse section (K) of embryos stained by in situ hybridisation showing expression of hmcn2 in the tail region of the zebrafish embryo at 24 hpf (I) and 48 hpf (J,K). While at 24 hpf, hmcn2 is expressed in the fin fold epidermis and the somites, (I), it becomes confined to fin mesenchyme cells at 48 hpf (J,K). probe Lateral view of a 48 hpf embryo injected with fibrillin2 MO, showing strong blistering of the medial fin (M) compared to uninjected control (L). (N) Lateral view showing expression of fbn2 in the medial fin fold of the tail at 24 hpf as well as in floor plate, hypochord and notochord. EXPRESSION / LABELING:
PHENOTYPE:
|
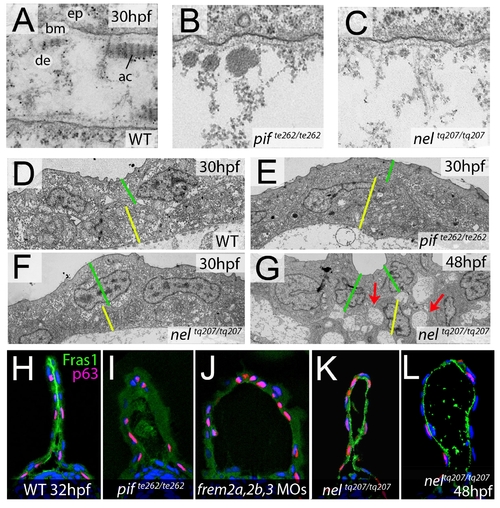
fras1 and hmcn1 mutants display blister formation at identical sites below the basement membrane; however, in contrast to Frem2/3 proteins, Hmcn1 is dispensable for Fras1 stabilisation. (A–C) Electron micrographs of the sub-epidermal space of medial fin folds at 30 hpf in WT (A), pifte262/te262 (B), and neltq207/tq207 (C) embryos. Epidermal cells (indicated by ‘ep’ in A) are at the top of all panels as well as in the lower part of A. The lamina densa of the basement membrane (labelled with ‘bm’ in A), including the sublamina densa, is attached to the epidermal cells in all three panels. Below the bm, electron dense material is evident as actinotrichia (ac) or dermis material (de), which appears disorganized and in the two mutants (B,C). (D–G) Low power electron micrographs of the apical portion of the fin fold in WT (D), pifte262/te262 (E), and neltq207/tq207 (F–G) embryos at 30 hpf (D–F) and 48 hpf (G). Cell–cell adhesion is well preserved in both mutants at 30 hpf (E–F), but at 48 hpf, when the blister begins to collapse, cell-cell boundaries become compromised (G, red arrows). The basal and outer enveloping layers are indicated with yellow and green bars respectively. (H–L) Transverse sections fluorescently immunostained for Fras1 (green), epidermal p63 (red) and counterstained with DAPI (blue) at 30 hpf (H–K) and 48 hpf (L). Fras1 immunoreactivity is evident between the fin folds in WT embryos (H), but lost in pifte262/te262 mutants (I) as well as in embryos injected with MOs against frem2a, frem2b, and frem3 (J). In contrast, it is retained in neltq207/tq207 embryos at both 30 hpf (K) and 48 hpf (L), when blistering is even more severe. |
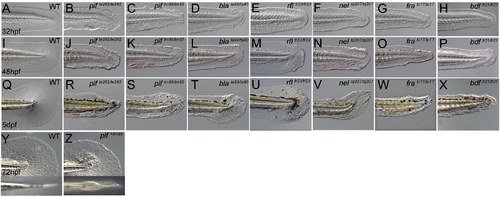
Zebrafish fin mutants can be classed in two phenotypic groups. (A–X) Lateral Normarski images of the mutants pinfin (B–C, J–K, R–S), blasenta90 (D, L, T), rafelsfr23 (E,M,U), nageltq207 (F, N, V), fransentc17 (G, O, W) and badfinfr21 (H, P, X) displaying medial fin defects compared to wild-type embryos (A,I,Q). Embryos are shown at 32 hpf (A–H), 48 hpf (I–P) and 5 dpf (Q–X). Images of both a strong (pifte262; B, J, R) and a weak (piftm95; C, K, S) allele of pinfin are shown, which along with blasen, rafels and nagel, all display blisters within the fin fold. In contrast fransen and badfin mutants do not show blisters, rather dysmorphogenesis from 32 hpf onwards. Within the group of blister mutants, there was a range of severity, such that the blisters of the weak pinfin allele (piftm95) and the single blasen allele (blata90) appear quite small at 30 hpf and are only visible in some mutant embryos at 48 hpf, whilst the blisters of the strongest pinfin allele (pifte262) are prominent at 30 hpf and always visible at 48 hpf. The blisters of the rafels alleles are clear but only prominent in the posterior medial fin at 48 hpf and not evident at 32 hpf. The extent of fin fold degeneration is more severe at 5 dpf in the strong pinfin allele than either the blasen or weak pinfin allele. All three nagel alleles display large blisters covering much of the fin fold field, but rarely affect the blood islands. Like the strong pinfin allele, these blisters persist until 48 hpf at which point the fin begins to degenerate. (Y–Z) Uniquely piftm95/+ heterozygous embryos display a mild fin blister phenotype (Z-arrow) seen in either a lateral view (top panel) or dorsal view (lower panel) and compared to a WT sibling (Y). |
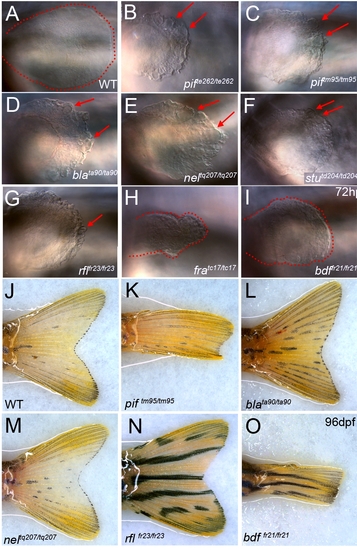
Pectoral and adult tail fin phenotypes. (A–I) Lateral views of pectoral fins at 72 hpf showing the blisters (red arrows) present in pifte262/te262 (B), piftm95/ttm95 (C), blata90/ta90 (D), neltq207/tq207 (E), stutd204/td204 (F) and rflfr23/fr23 (G) embryos compared to WT (A). The dysmorphogenesis of the pectoral pins in fratc17/tc17 (H) and bdffr21/fr21 (I) is highlighted with the edge of the fin circumscribed by red dashed line, clearly showing the reduction of the fin compared to WT (A). (J–O) Adult fin phenotypes at 96 dpf: the tail fins of piftm95/ttm95 (K) and bdffr21/fr21 (O) mutants are reduced compared to WT (J), blata90/ta90 (L), neltq207/tq207 (M) and rflfr23/fr23 (N). |
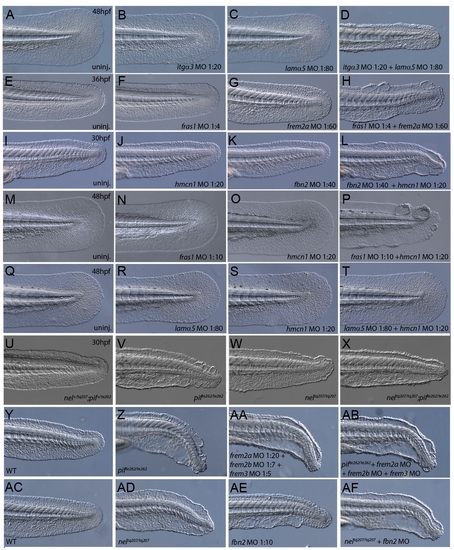
Synergistic interaction and compound mutant/morphant analyses. (A–T) Demonstration of synergistic interactions between itga3 and lama5 (A–D), fras1 and frem2a (E–H), hmcn1 and fbn2 (I–L), and fras1 and hmcn1 (M–P), but not hmcn1 and lama5 (Q–T). Images show lateral views of embryos tails at 30 hpf (I–L), 36 hpf (E–H) or 48 hpf (A–D; M–T) after injection of sub-phenotypic doses of morpholinos against itga3 (B), fras1 (F,N), frem2a (G), hmcn1 (J,O,S), fbn2 (K) or lama5 (C,R). All single morphants appear as their uninjected WT controls (A,E,I,M,Q). In contrast, a dysmorphogenic phenotype is seen upon itga3 and lama5 co-injection (D), whilst blisters are evident upon combined injection of fras1 and frem2a (H), hmcn1 and fbn2 (L) and fras1 and hmcn1 (P). Neither phenotype is seen upon co-injection of hmcn1 and lama5 (T). (U-X) Lateral views of the medial fins of pifte262/te262 (V), neltq207/tq207 (W), pif+/te262; nel+/tq207 (U) and pifte262/te262; neltq207/tq207 (X) embryos at 30 hpf, showing that blisters in the double mutant are more severe than in neltq207/tq207, but of equal severity to pifte262/te262. (Y-AB) Lateral views on tails of embryos at 32 hpf, demonstrating that the defects due to triple loss of frem2a/2b/3 combined with loss of fras1 (AB) appears as severe as loss of either fras1 alone (Z) or combined loss of frem2a/2b/3 (AA). WT embryo is shown for comparison (Y). (AC-AF) Additive function of hmcn1 and fbn2 as assessed by generation of compound mutant/strong morphant embryos imaged at 32 hpf. Injection of strong doses of fbn2 MO into neltq207/tq207 (AF) generated embryos with stronger blistering than neltq207/tq207 (AD) or strong fbn2 morphants (AE) alone. |
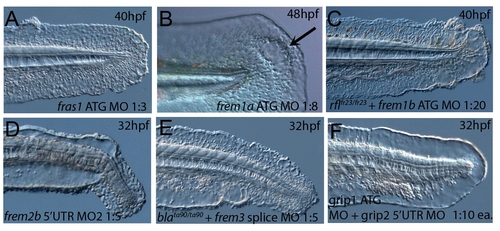
Confirmation of morphant phenotypes with second morpholino. Injection of second non-overlapping morpholinos was used to verify morphant phenotypes. Injection of translation-blocking morpholinos against fras1 (A), frem1a (B) and frem2b (D) into WT embryos realised blisters in the fin fold comparable to those seen with the original morpholinos. The fin blister phenotypes of rafels (C) and blasen (E) could be enhanced by the injection of morpholinos targeting the frem1b 5′UTR and frem3 ATG respectively. Co-injection of grip1 ATG and grip2 5′UTR morpholinos also yield strong blistering of the fin fold identical to that obtained with the original MOs (F). |

Fras1 distribution is compromised in sturgeon mutant fins. Transverse sections of WT (A) or stu-/- (B) posterior medial fins at 32 hpf, fluorescently immunostained for Fras1 (green), p63 (pink) and DAPI (blue). The extent of relative proximal extension of Fras1 protein appears reduced in stu-/- embryos (B) compared to WT (A). Extent of Fras1 staining is delineated by adjacent white line. Note that in the mutant, levels of Fras1 protein in the smaller domain appear correspondingly higher. |