FIGURE SUMMARY
Title

Neuronal Regulation of the Spatial Patterning of Neurogenesis

Authors
Gonzalez-Quevedo, R., Lee, Y., Poss, K.D., and Wilkinson, D.G.
Source
Full text @ Dev. Cell

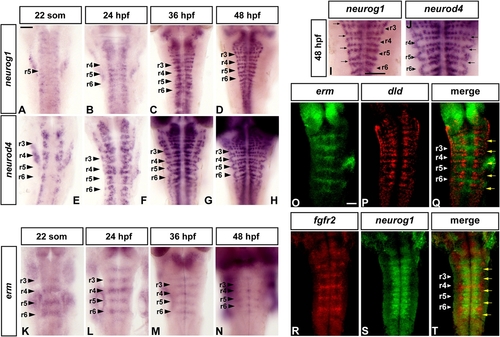
FGF Signaling Is Restricted to Nonneurogenic Regions in the Zebrafish Hindbrain
Dorsal views of flat mounted embryos, anterior to the top, at the indicated stages. Following in situ hybridization, embryos of the same batch were developed for the same amount of time. Arrowheads indicate segment centers; arrows point at hindbrain boundaries. Scale bars, 50 μm. (A–H) Time course of neurog1 (A–D) and neurod4 (E–H) expression from 22 somites to 48 hr. (I and J) Higher-power views showing the spatial restriction of neurogenesis marked by neurog1 (same embryo as [D]) and neurod4 ([J], same embryo as [H]). (K–N) erm expression. (O–T) Double fluorescent in situ hybridization using probes for erm and dld (O–Q), and fgfr2 and neurog1 (R–T). Images shown are a merge of confocal stacks through the hindbrain at 36 hpf.

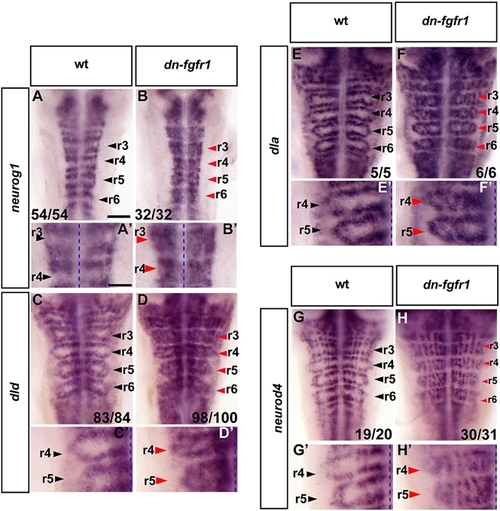
Blocking FGFR Activation Results in Proneural Gene Expression and Differentiating Neurons in Segment Centers
In situ hybridization of 40 hpf zebrafish to detect proneural gene expression (neurog1, dld, dla; [A–F] and [A′–F′]) or differentiating neurons (neurod4; [G and H and G′ and H′]) in either wild-type (wt) or dominant-negative fgfr1 embryos (Tg(hsp70l:dnfgfr1-EGFP)). Heat shock was started at the 22 somite stage. Black arrowheads indicate segment centers; red arrowheads indicate ectopic neurogenesis. (A–H) Scale bar, 50 μm. (A′–H′) Higher-power view of images in (A)–(H); scale bar, 25 μm. Dashed line, midline. See also Figure S1.

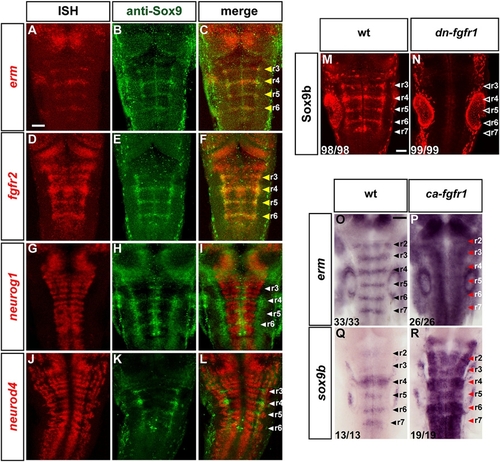
FGF Signaling Maintains a Sox9b- Expressing Population in Segment Centers
(A–L) In situ hybridization for erm, fgfr2, neurog1, or neurod4 (red), followed by immunostaining with anti-Sox9 antibody (green). Images shown are a projection of confocal stacks. Scale bar, 50 μm. White arrowheads indicate segment centers; yellow arrowheads indicate colocalization of Sox9b with fgfr2 and erm. The staining in segment centers is due to Sox9b, as it is lost in Sox9b morphant embryos (not shown).
(M and N) Whole-mount immunostaining of Sox9b in 36 hpf wt (M) or transgenic dominant-negative fgfr1 embryos (Tg(hsp70l:dnfgfr1-EGFP) [N]). White arrowheads indicate segment centers in wt embryos; open arrowheads in transgenic embryos point at centers where Sox9b expression is absent. Images shown are merged confocal stacks. Scale bar, 20 μm.
(O–R) In situ hybridizations of 26 hpf wt embryos (left) or embryos expressing constitutively active FGFR1 (Tg(hsp70:ca-fgfr1)), using erm (O and P) or sox9b (Q and R) probes. Embryos were heat shocked at 24 hpf and fixed 2 hr later. Arrowheads indicate segment centers; red arrowheads indicate upregulation of erm or sox9b expression. Scale bar, 50 μm. See also Figure S2.

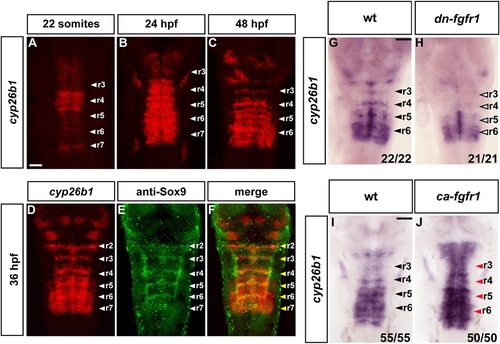
Cyp26b1 Is Expressed in Segment Centers and Regulated by FGF Signaling
(A–D) In situ hybridizations to detect the time course of cyp26b1 expression. Images are a merge of confocal stacks of Fast Red staining. Scale bar, 50 μm. White arrowheads indicate segment centers. (D–F) In situ hybridization of cyp26b1 followed by immunostaining with anti-Sox9 antibody. Yellow arrowheads show colocalization of cyp26b1 with Sox9b in segment centers.
(G and H) In situ hybridization of 40 hpf embryos to detect cyp26b1 expression in wt (G) or dominant-negative FGFR1 embryos (Tg(hsp70l:dnfgfr1-EGFP)) (H). Heat shocks were started at the 22 somite stage. Black arrowheads indicate segment centers; open arrowheads indicate the disappearance of cyp26b1 expression from centers. Scale bar, 50 μm.
(I and J) In situ hybridization of 26 hpf embryos to detect cyp26b1 in either wt (I) or constitutively active fgfr1 embryos, Tg(hsp70:ca-fgfr1) (J). Heat shocks were started at 24 hpf and embryos fixed 2 hr later. Black arrowheads indicate segment centers; red arrowheads centers in embryos with cyp26b1 upregulation. Scale bar, 50 μm.

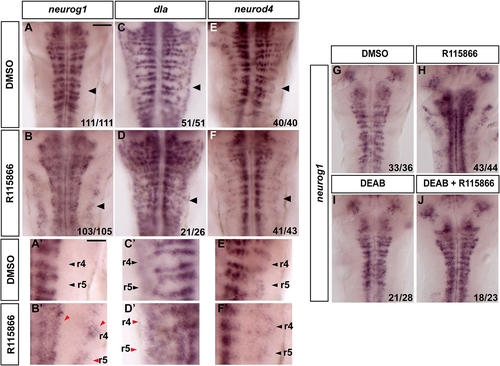
Blocking Cyp26 Activity Results in Premature Neurogenesis
(A–F) In situ hybridization of 40 hpf embryos to detect expression of neurog1 (A and B), dla (C and D) or neurod4 (E and F) in DMSO- or R115866-treated embryos. Treatments were started at 24–26 hr. Black arrowhead points at r5. Scale bar, 50 μm. (A′–F′) Higher-power views of r4 and r5 shown in A–F (black arrowheads).
Red arrowheads indicate ectopic proneural expression. Scale bar, 25 μm.
(G–J) Blocking RA signaling with DEAB partially rescues loss of Cyp26. In situ hybridization of 36 hpf embryos to detect expression of neurog1 in DMSO (G), R115866 (H), DEAB (I), or R115866 + DEAB (J) -treated embryos.

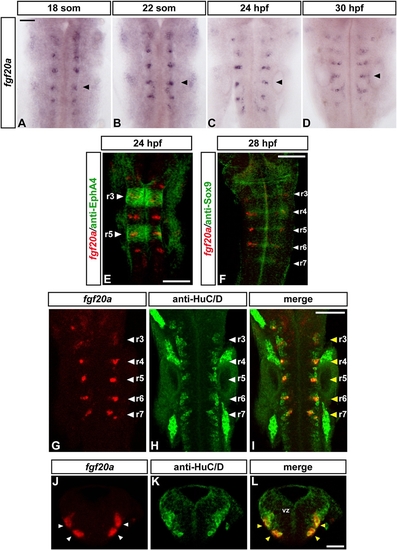
fgf20a Is Expressed in Neurons at Segment Centers
(A–D) Time course of fgf20a expression at 18 somites (A), 22 somites (B), 24 hpf (C), and 30 hpf (D). Embryos belong to the same batch and were developed for the same amount of time. Black arrowheads point at the center of r5. Scale bar, 50 μm. (E–I) Merge of confocal stacks of double-stained embryos. Scale bar, 100 μm. (E) In situ hybridization of fgf20a (red) and anti- EphA4 staining (green) to reveal r3 and r5 (white arrowheads) at 24 hr.
(F) In situ hybridization of fgf20a (red) and antibody staining for Sox9b (green) in 28 hpf embryo. White arrowheads indicate segment centers. (G–I) In situ hybridization of fgf20a (red) and antibody staining for the panneuronal marker HuC/D in 24 hpf embryos. White arrowheads indicate segment centers; yellow arrowheads show colocalization of fgf20a with specific HuC/D-expressing neurons.
(J–L) Double labeling of fgf20a (red) and HuC/D (green). Images show a merge of confocal stacks through r4 at 24 hpf in transverse sections (dorsal is to the top). In r4, fgf20a-expressing cells form clusters (white arrowheads) in the mantle zone and colocalize with specific HuC/D-expressing neurons (yellow arrowheads). VZ, ventricular zone. Scale bar, 50 μm. See also Figure S3.

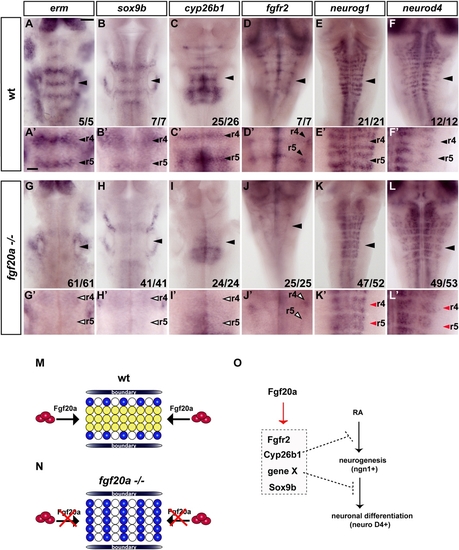
fgf20a Is Required for Inhibition of Neurogenesis in Segment Centers
(A–L) In situ hybridizations of wt (A–F) or fgf20a homozygous embryos (G–L) raised at 25°C. A′–L′ show higher-power images of A–L. Scale bar, 50 μm for A–L; 20 μm for A′)–(L′. erm expression in segment centers is significantly reduced in fgf20a mutants (open arrowheads in G′). Markers of segment centers, sox9b, cyp26b1, and fgfr2, are greatly decreased in fgf20a-/- embryos (open arrowheads [H′–J′]). (K and L) fgf20a mutant embryos have ectopic neurogenesis in segment centers, detected by neurog1 (E and K) and neurod4 expression (L and F). Red arrowheads indicate ectopic neurogenesis in segment centers (K′ and L′).
(M and N) Model of the patterning of neurogenesis by fgf20a in hindbrain segments. In wt embryos (M), fgf20a secreted from neurons in the adjacent mantle region (red ovals) prevents neuronal differentiation (blue circles) in segment centers by maintaining a population of progenitors (yellow circles). (N) In fgf20a mutants, there is ectopic neurogenesis and low-level expression of segment center markers.
(O) Summary of the regulation of genes in the nonneurogenic zone of progenitors in segment centers. fgf20a upregulates a set of genes that control different aspects of maintaining an undifferentiated population.

Acknowledgments
This image is the copyrighted work of the attributed author or publisher, and ZFIN has permission only to display this image to its users. Additional permissions should be obtained from the applicable author or publisher of the image.

Reprinted from Developmental Cell, 18(1), Gonzalez-Quevedo, R., Lee, Y., Poss, K.D., and Wilkinson, D.G., Neuronal Regulation of the Spatial Patterning of Neurogenesis, 136-147, Copyright (2010) with permission from Elsevier. Full text @ Dev. Cell