
- Title
-
Structural requirements for PACSIN/Syndapin operation during zebrafish embryonic notochord development
- Authors
- Edeling, M.A., Sanker, S., Shima, T., Umasankar, P.K., Höning, S., Kim, H.Y., Davidson, L.A., Watkins, S.C., Tsang, M., Owen, D.J., and Traub, L.M.
- Source
- Full text @ PLoS One
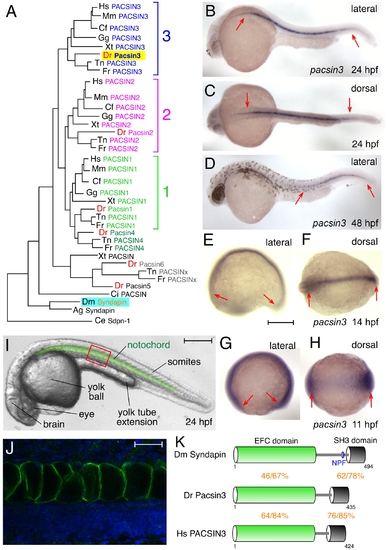
The zebrafish Pacsin3 orthologue. (A) PACSIN family dendrogram (TreeFam accession TF313677). Mm, Mus musculus; Cf, Canis familiaris; Gg, Gallus gallus; Xt, Xenopus tropicalis; Dr Danio rerio; Tn, Tetraodon nigroviridis; Fr, Fugu rubripes; Ci, Ciona intestinalis; Ag, Anopheles gambiae; Ce, Caenorhabditis elegans. (B–H) Embryonic pacsin3 mRNA localization (purple) by whole mount in situ with pacsin3 antisense riboprobe at the various developmental stages noted. Anterior is left. Bar = 250 μm. (I) Lateral view of a 24 hpf control embryo with the notochord pseudocolored in green to highlight the location of this organ. Other structures apparent at this stage are labeled. Bar = 250 μm. (J) Indirect immunolabeling (green) of Pacsin3 with affinity-purified antibodies in the notochord at a lateral region of a fixed 24 hpf embryo, analogous to the red box in I. Nuclei are counterstained with Hoechst (blue). Bar = 50 μm. (K) Schematic of the organizational relatedness and domain structural identity/similarity between selected Syndapin/PACSIN isoforms. EXPRESSION / LABELING:
|
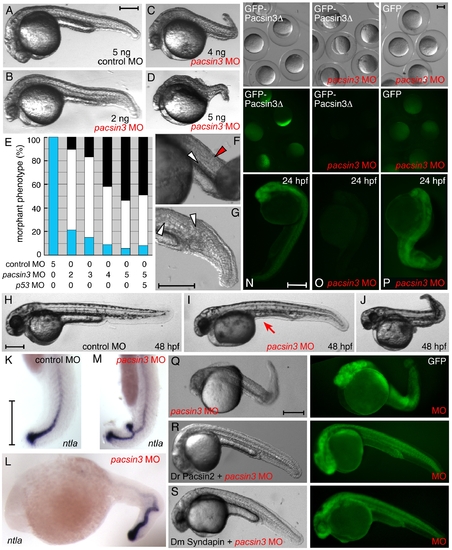
Inactivation of Pacsin 3 in zebrafish embryos. (A–D) Morphology of representative control (scrambled) or pacsin3 MO-injected 24 hpf embryos. Anterior is left. Bar = 250 μm. (E) Phenotypic quantitation of normal (blue), mild (white), or severely (black) affected embryos injected with control (n = 42) or 2 ng (n = 48), 3 ng (n = 53), 4 ng (n = 57), or 5 ng (n = 54) pacsin3 MO, or with both 5 ng pacsin3 and 5 ng p53 MOs (n = 61). (F–G) Close-up views of abnormal notochord (white arrowheads) and improperly structured somites (red arrowhead) in 24 hpf pacsin3 MO-injected embryos. Bar = 250 μm. (H–J) Representative lateral views of control or pacsin3 MO-injected 48 hpf embryos. Note lack of the yolk tube (arrow) even in mildly affected pacsin3 morphants. Bar = 250 μm. (K–M) Localization of ntla mRNA in typical control or pacsin3 MO-injected 24 hpf embryos. Anterior is up in K and M. Bar = 250 μm. (N–P) GFP fluorescence from injection of 25 pg GFP-Pacsin3Δ (N, O) or GFP (P) mRNA into embryos together with no (N) or 5 ng pacsin3 MO (O, P) at the one-cell stage. Groups of embryos still within the chorion at ∼5 hpf and typical individual 24 hpf embryos show effective and selective silencing of the pacsin3 transcript. Bar = 250 μm. (Q–S) Gross morphology of 3 ng pacsin3 MO-injected embryos co-injected with 50 pg GFP (Q) or 50 pg GFP and either 25 pg D. rerio Pacsin2 (R) or D. melanogaster Syndapin (S) mRNA. Bar = 250 μm. |

The pacsin3 MO phenotype. (A–D) Lateral notochord morphology in 5 ng control or pacsin3 MO-injected 24 hpf embryos treated with (B and D) or without (A and C) 10 mM β-aminoproprionitrile to disrupt the notochordal sheath. The relative angle of the normally chevron-shaped somites is indicated (purple). Anterior is left. Bar = 250 μm. (E–F) Thin section EM images of the trilaminar perinotochordal sheath in 5 ng control or pacsin3 MO-injected 24 hpf embryos. Arrows demarcate the boundary of the sheath. Bar = 0.5 μm. (G–J) Close-up dorsal views of the chordamesoderm at the 10-somite stage in 5 ng control (G and I) or pacsin3 (H and J) MO-injected embryos. Anterior is left. (I–J) Embryonic myoD mRNA localization by whole mount in situ. Bar = 250 μm. (K–L) Representative confocal sections of the lateral notochord region from BODIPY-Texas red labeled [88] live 24 hpf embryos after 5 ng control or pacsin3 MO injection. Bar = 50 μm. (M–N) Thin section EM micrographs of cross-sections through the notochord of 5 ng control or pacsin3 MO-injected 24 hpf embryos. Extra-notochord tissue is pseudocolored yellow, and vacuoles (V) and the perinotochordal sheath (arrows) are indicated. Bar = 10 μm. (O–R) Embryonic sonic hedgehog (shh) and patched1 (ptc1) mRNA localization by whole mount in situ in 5 ng control or pacsin3 MO-injected 24 hpf embryos. Bar = 250 μm. EXPRESSION / LABELING:
PHENOTYPE:
|
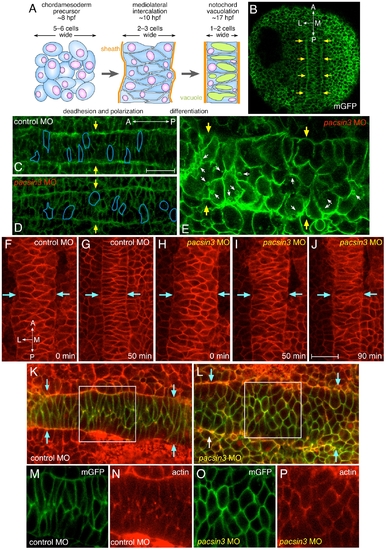
Early midline defects in pacsin3 morphants. (A) Schematic illustration of the mediolateral intercalation process in the forming notochord. (B–C) Representative confocal optical sections of fixed, mGFP and control MO-injected embryos at the 3-somite stage focused on the mesodermal cell layer. The lateral notochord border is indicated (arrows), as are the anterioposterior and mediolateral axes. Bar = 50 μm. (D–E) Representative confocal optical sections of fixed, mGFP and 5 ng pacsin3 MO-injected embryos at the 3-somite stage with moderate (D) or severe (E) phenotypes. The shape of several cells is traced (blue lines), and internal membrane vesicles (small arrows) are shown. (F–J) Selected dorsal midline views from time-lapse recording at the beginning of segmentation (∼10 hpf) of control (7.5 ng; F, G and Video S1) or pacsin3 (7.5 ng; H–J and Video S2 and S3) MO-injected embryos also expressing membrane mcRFP. The lateral notochord border is indicated (arrows). Bar = 50 μm. (K–P) Representative confocal optical sections of fixed, mGFP and control or pacsin3 MO-injected embryos at the 3-somite stage stained with fluorescent phalloidin to reveal actin. Anterior is left. The lateral notochord border is indicated (K and L, arrows), and the separated mGFP (green) and actin (phalloidin, red) channels of the regions boxed in K and L are shown (panels M and O and N and P, respectively). PHENOTYPE:
|
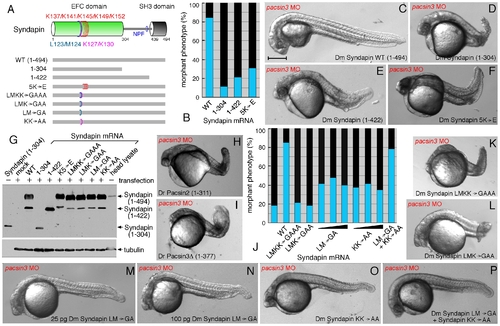
Structural requirements for Syndapin operation. (A) Schematic depiction of the various Syndapin mutants analyzed. (B) Quantitative phenotypic analysis of normal (blue) or abnormal (black) pacsin3 (3 ng MO) morphants coinjected with 25 pg Syndapin WT (n = 185) or Syndapin 1–305 (n = 97), 1–423 (n = 98) or 5K′E (n = 121) mutant mRNAs. Bar = 250 μm. (C–F) Representative images of the phenotype of 24 hpf pacsin3 MO embryos expressing the indicated Syndapin proteins. (G) Immunoblot analysis of expression of various Syndapin fragments and mutants from transfected pCS2+ in HeLa cells. The anti-Syndapin serum recognizes the EFC domain; as positive controls, purified Syndapin (1–304) and a Drosophila head lysate containing endogenous Syndapin were used. (H–I) Representative images of pacsin3 MO embryos also expressing D. rerio Pacsin2 or Pacsin3 SH3Δ proteins. (J) Quantitative phenotypic analysis of normal (blue) or abnormal (black) pacsin3 (3 ng MO) morphants alone (n = 50) or coinjected with 25 pg Syndapin WT (n = 185), LMKK→GAAA (n = 119), LMK→GAA (n = 99), LM→GA (n = 95; 50 pg, n = 48; 100 pg, n = 43), KK→AA (n = 122; 50 pg, n = 57; 100 pg, n = 76) or 25 pg of both the LM→GA and KK→AA (n = 115) mutant Syndapin mRNAs. (K–P) Representative images of the phenotype of pacsin3 MO embryos expressing the indicated Syndapin proteins. |
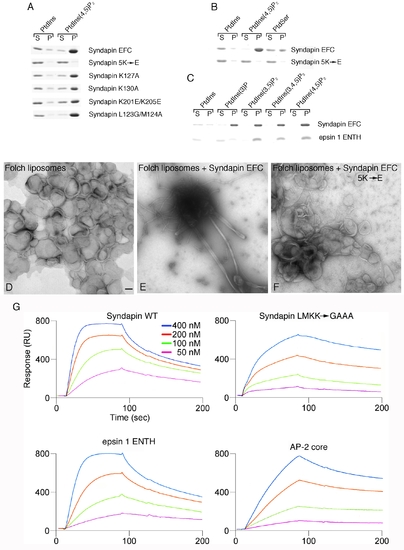
Syndapin EFC domain-liposome interactions. (A) Syndapin EFC domain mutant binding to synthetic liposomes. Coomassie-blue stained gels of aliquots of supernatant (S) and pellet (P) fractions from sedimentation assays are shown. (B) Syndapin EFC domain binding to PtdSer containing liposomes. A three-times excess of PtdSer (30%) is bound less effectively than are PtdIns(4,5)P2 (10%) containing liposomes. (C) The syndapin EFC domain binds to a similar extent to PtdIns(3)P, PtdIns(3,5)P2, PtdIns(4,5)P2 and PtdIns(3,4,5)P3, but the epsin 1 ENTH domain does not bind PtdIns(3)P. This indicates that the interaction of the Syndapin EFC domain with liposomes is largely via general electrostatics and not strongly stereospecific. (D-F) Negatively-stained transmission electron micrographs of liposome tubulation assays with the Syndapin EFC domain. Folch lipid liposomes alone (panel D), Folch liposomes plus the Syndapin EFC domain (panel E), Folch liposomes plus Syndapin EFC 5K→E mutant (panel F). Scale bar = 100 nm. Notice that the wild-type Syndapin EFC domain generates both broad (~ 80 nm) and narrow (~ 20 nm) diameter tubules as well as low levels of small spherical structures that appear to be vesicles. (G) Sensogram traces from assays using PtdIns(4,5)P2-containing 200 nm synthetic liposomes immobilized on an L1 chip. The indicated concentration of the Drosophila Syndapin EFC domain (1-304; WT), Syndapin (1-304) LMKK→GAAA mutant, epsin 1 ENTH domain or AP-2 core were flowed over the liposomes followed by washing. The derived equilibrium dissociation constant (KD) values are: 88 nM for the wild-type Syndapin EFC domain, 1.2 μM for the Syndapin LMKK→GAAA mutant, 590 nM for the epsin 1 ENTH domain and 7.3 μM for the heterotetrameric AP-2 core. |
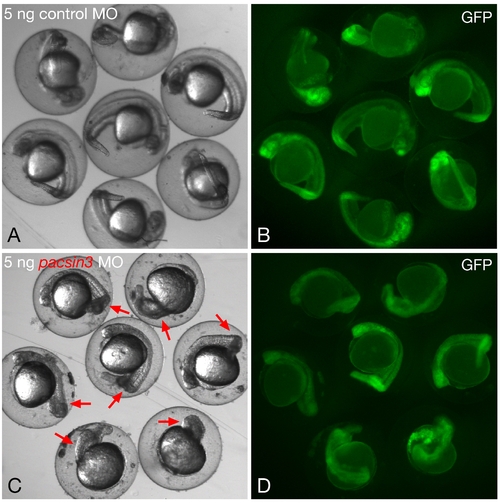
Phenotypic range with 5 ng pacsin3 MO. (A–B) Gross morphology of embryos within the chorion at 24 hpf after injection of 5 ng control MO and 50 pg GFP cRNA at the one- to two-cell stage. Bar = 250 μm. (C–D) Gross morphology of embryos within the chorion at 24 hpf after injection of 5 ng pacsin3 MO and 50 pg GFP cRNA at the one- to two-cell stage. Red arrows indicate obvious morphological abnormalities in the morphant embryos. Note too the generally reduced anterioposterior axial length in the pacsin3 MO-injected embryos. |

Overexpression of Syndapin mRNA in a wild-type background. (A–I) Representative images of dechorionated 24 hpf embryos after injection of 50 pg capped mRNA encoding GFP (A), or GFP together with 25 pg Drosophila melanogaster (Dm) Syndapin wild type (WT) (B), Dm Syndapin (1–304) (C), Dm syndapin (1–422) (D), Dm Syndapin 5K→E (E), Dm Syndapin LMKK→GAAA (F), Dm Syndapin LMK→GAA (G), Dm Syndapin LM→GA (H), Dm Syndapin LM→GA + KK→AA (I). Notice that at this concentration none of the cRNA injections cause any obvious morphological defects. Bar = 250 μm. |