
- Title
-
Sleep-wake regulation and hypocretin-melatonin interaction in zebrafish
- Authors
- Appelbaum, L., Wang, G.X., Maro, G.S., Mori, R., Tovin, A., Marin, W., Yokogawa, T., Kawakami, K., Smith, S.J., Gothilf, Y., Mignot, E., and Mourrain, P.
- Source
- Full text @ Proc. Natl. Acad. Sci. USA
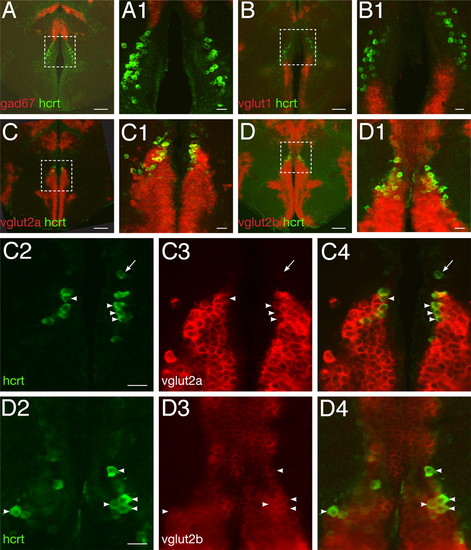
Zebrafish HCRT neurons are glutamatergic. (A–D) and close-ups (A1–D1) Double fluorescent ISH between hcrt mRNA and fast neurotransmitter phenotype markers as visualized using confocal microscopy on adult brain sections (reconstructed stacks of 0.5- or 1-μm sections). (C2–C4) and (D2–D4): single-plane, high-magnification pictures of hcrt cells (green, C2, D2), vglut2a or -b cells (red, C3, D3), and merged views (C4, D4). Arrowheads indicate cells coexpressing hcrt and vglut2a or vglut2b. Note the frequent colocalization. Absence of coexpression is occasionally observed (arrow). [Scale bar, 100 μm (A–D), 20 μm (A1–D1, C2–C4, and D2–D4).] EXPRESSION / LABELING:
|
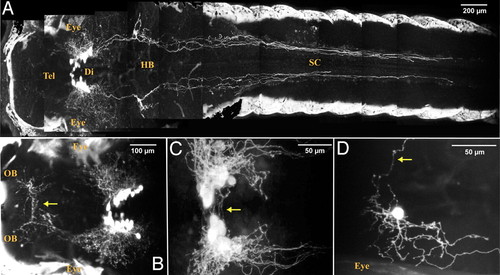
A stable hcrt:EGFP transgenic line reveals the entire HCRT circuit of a living larva. (A–C) Two-photon imaging of a 7dpf stable transgenic larva with head to the left, dorsal views. (A and close-up B) Composite picture showing the HCRT cell bodies in the diencephalon (Di) and their processes in the hindbrain (HB) and spinal cord (SC) and in the telencephalon (Tel) directed toward the olfactory bulbs (OB). In A and B, white areas on both sides of the larva correspond to skin autofluorescence. Commissural projections are observed ventrally to the HCRT cell body clusters (C, arrow) and in the anterior telencephalon (B, arrow, commissura anterior). (D) Mosaic expression of a nonintegrated hcrt:EGFP transgene allowing the observation of a single HCRT neuron harboring both commissural (arrow) and ipsilateral processes. EXPRESSION / LABELING:
|
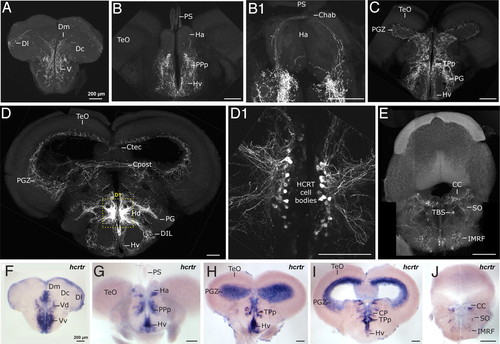
Adult zebrafish HCRT circuit. (A–E) Confocal imaging of 100 μm transversal brain sections from a stable hcrt:EGFP transgenic adult fish (reconstructed stacks of 0.5- or 1-μm sections). Note the compact organization of the HCRT cell bodies in the periventricular hypothalamus (D and dashed-box close up in D1). (F–J) hcrtr mRNA ISH pattern in equivalent brain sections to A–E. Note the similar distribution of HCRT fibers and hcrtr mRNA. Compare sections of telencephalon (A vs. F), telencephalon-midbrain boundary (B and B1 vs. G), anterior diencephalon and mesencephalon (C vs. H), mid diencephalon and mesencephalon (D vs. I), rhombencephalon (E vs. J). Chab, commissura habenularum; Ctec, commissura tecti; Cpost, commissura posterior; CC, crista cerebellaris; CP, central posterior thalamic nucleus; D, dorsal telencephalic area; Dm, medial zone of D; Dc, central zone of D; Dl, lateral zone of D; DIL, diffuse nucleus of the inferior lobe; Ha, habenula; Hv, ventral zone of the periventricular hypothalamus; Hd, dorsal zone of the periventricular hypothalamus; IMRF, intermediate reticular formation; PG, preglomerular nucleus; PGZ, periventricular gray zone of the optic tectum; PPp, parvocellular preoptic nycleus, posterior part; PS, pineal stalk; SO, secondary octaval population; TBS, tractus bulbospinalis; TeO, optic tectum; TPp, periventricular nucleus of posterior tuberculum; V, ventral telencephalic area; Vv, ventral nucleus of V; Vd, dorsal nucleus of V. EXPRESSION / LABELING:
|
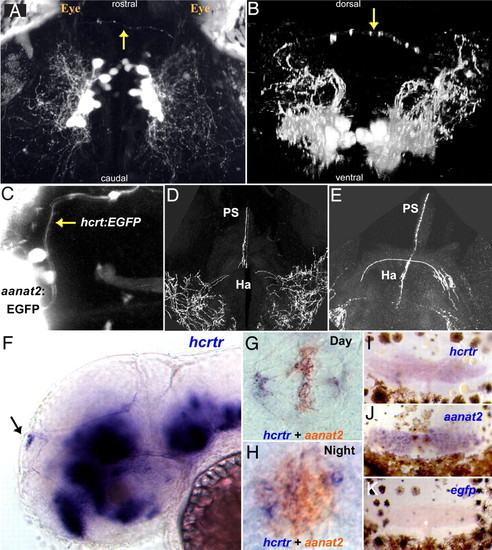
The HCRT-pineal gland circuit. (A and B) Dorsal and frontal views of the brain of a 7 dpf hcrt:EGFP transgenic larva imaged by two-photon microscopy. HCRT axons (arrows) projecting toward the pineal gland are observed. (C) A dorsal image of 6 dpf transgenic larva carrying two transgenes; an EGFP reporter driven by hcrt (hcrt:EGFP) and the pineal-specific aanat2 (aanat2:EGFP) promoters, demonstrate direct axon projection (arrow) to the pineal gland. (D and E) Close-ups of two adjacent transversal hcrt:EGFP adult brain sections showing HCRT projections to the habenula and the pineal gland stalk. (F) Lateral and (G and H) dorsal views of whole-mount in situ hybridization of 2-dpf embryos. (F) hcrtr mRNA is expressed in several regions of the brain (16) including the pineal gland (arrow). Double ISH experiment with aanat2 demonstrates that hcrtr is expressed in the pineal gland during the day (G) and the night (H). Similarly, in adult animals, hcrtr is expressed in the pineal gland (I). aanat2 (J) and egfp (K) probes were used as positive and negative controls, respectively. Adult pineal glands (I–K) were removed with the upper skull and skin hence presence of brown melanophores cells in the preparations. |

ZFIN is incorporating published figure images and captions as part of an ongoing project. Figures from some publications have not yet been curated, or are not available for display because of copyright restrictions. |
|
ZFIN is incorporating published figure images and captions as part of an ongoing project. Figures from some publications have not yet been curated, or are not available for display because of copyright restrictions. |
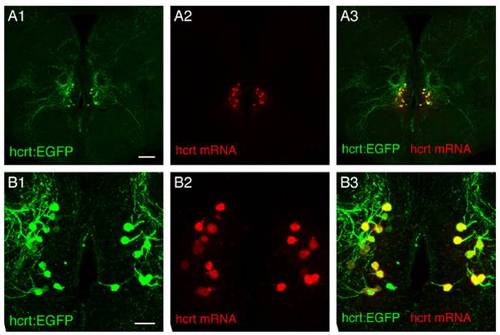
(A1–A3 and associated close-ups B1–B3) Double fluorescent ISH and Immunostaining between endogenous hcrt mRNA and EGFP protein driven by hcrt promoter as visualized using confocal microscopy on brain sections of adult hcrt:EGFP transgenic fish (reconstructed stacks of 0.5- or 1-μm sections). Note the very good colocalization demonstrating the specificity of the hcrt promoter fragment used in the transgenic lines. (Scale bar, 100 μm A1–A3; 20 μm B1–B3.) |
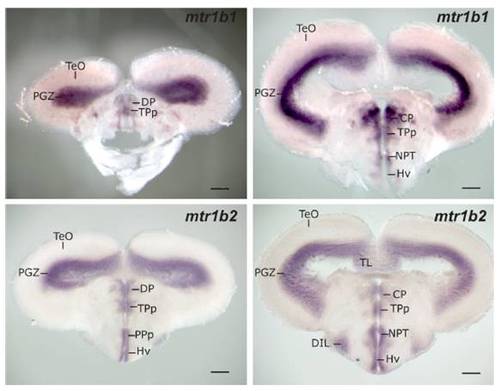
melatonin receptor 1b1 (NM_131394) and 1b2 (NM_131395) mRNA ISH patterns in adult brain sections. Note the similar distribution with HCRT fibers and HCRT receptor mRNA displayed in Fig. 3. CP, central posterior thalamic nucleus; DIL, diffuse nucleus of the inferior lobe; DP, dorsal posterior thalamic nucleus; Hv, ventral zone of the periventricular hypothalamus; NPT, posterior tuberal nucleus; PGZ, periventricular gray zone of the optic tectum; PPp, parvocellular preoptic nycleus, posterior part; TeO, optic tectum; TL, torus longitudinalis; TPp, periventricular nucleus of posterior tuberculum. (Scale bar, 200 μm.) EXPRESSION / LABELING:
|