
- Title
-
Probing events with single molecule sensitivity in zebrafish and Drosophila embryos by fluorescence correlation spectroscopy
- Authors
- Shi, X., Shin Teo, L., Pan, X., Chong, S.W., Kraut, R., Korzh, V., and Wohland, T.
- Source
- Full text @ Dev. Dyn.

Zebrafish embryo autofluorescence study. A: Overview of autofluorescence expression in lateral view 3 days postfertilization (dpf) AB wild-type embryo, excited with 100 μW 488-nm laser, long-pass 505 as emission filter. Overlay of transmission and fluorescence channel. The embryo was treated with PTU at 18 hpf to prevent pigmentation. B: Enlarged view of the square region in A. C: Fluorescence intensity trace of the red line in A. D: Normalized autofluorescence spectrum taken in the trunk region (yellow cross in B), shown together with enhanced green fluorescent protein (EGFP) fluorescence spectrum and 510AF23 emission filter. Scale bar = 200 μm. |
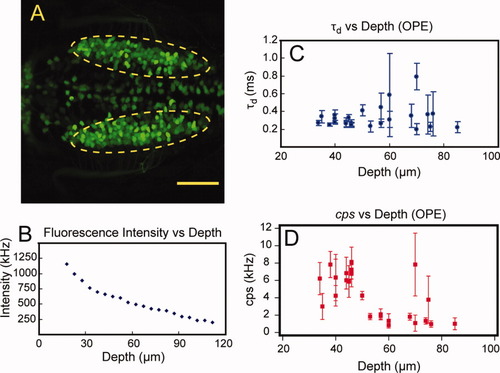
Penetration depth study using one-photon excitation. A: Dorsal view of vagal motor neurons of 3 dpf embryo of Islet-1-EGFP transgenic line as indicated in the dashed ellipse. B: Fluorescence intensity measurements of EGFP-expressing motor neurons at different depths. C: Diffusion time measurements by fluorescence correlation spectroscopy (FCS) at different cell depths. D: cps of FCS measurements at different cell depths. Scale bar = 50 μm. |
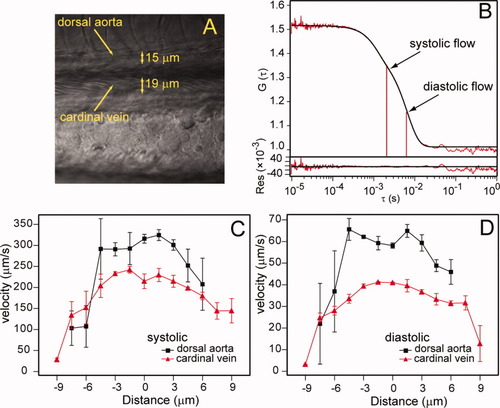
Blood flow measurements in live zebrafish embryos. A: Confocal image of the dorsal aorta and cardinal vein, 3 days postfertilization (dpf) AB, lateral view. B: A typical FCS flow measurement in the cardinal vein, showing both experimental curve (red) and fitting curve (black). At the bottom are the residuals of the fit. Experimental curves are fitted with a two flow model representing systolic and diastolic flow. C,D: Blood flow velocity profiles of systolic and diastolic flow, respectively. Results show measurements taken in the dorsal aorta (black) and cardinal vein (red). |
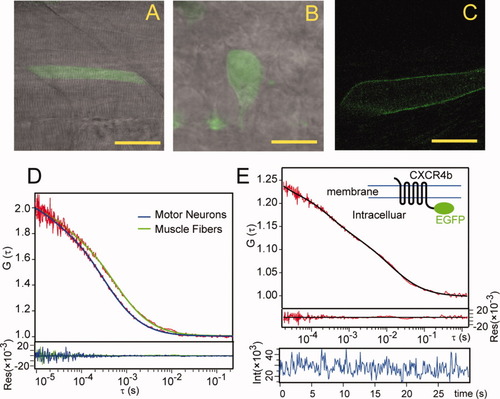
Diffusion coefficient measurements in zebrafish embryos. A,B: Confocal images of enhanced green fluorescent protein (EGFP) expressed muscle fibers (at posterior trunk region) and motor neurons (at hindbrain/spinal cord junction region), respectively. Lateral view. C: Confocal image of Cxcr4b-EGFP-expressing muscle fiber, membrane expression pattern was observed. D: Normalized autocorrelation curves of cytosolic EGFPs in muscle fibers and motor neurons. E: Autocorrelation and fitting curves of Cxcr4b-EGFP on membrane of muscle fibers, together with fitting residuals and fluorescence intensity trace. The inset is a schematic drawing of the construct. Scale bars = 40 μm in A, 10 μm in B, 20 μm in C. |
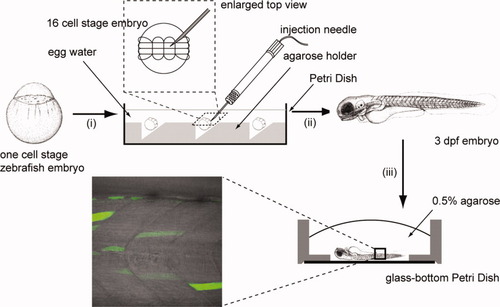
Zebrafish embryo preparation (i) one-cell stage embryos were collected and dechorionated. The embryos were aligned onto the agar holder in a Petri Dish and the orientation of the embryo was adjusted with a glass dropper that the animal pole was on top. The Petri dish was filled with egg water and the embryos were let to develop to the 16-cell stage. (ii) The DNA plasmid was microinjected into one of the four central blastomeres. The embryos were then incubated in egg water at 28.5°C to develop to 3 days postfertilization (dpf). (iii) Selected embryos were anaesthetized and mounted into 0.5% low-melting-temperature agar in a glass bottom Petri dish. The embryo body was pushed close to the surface of cover glass and the orientation of the embryo was adjusted with a needle. The specimen was then mounted in the microscope stage for subsequent confocal imaging and fluorescence correlation spectroscopy (FCS) measurements. |