
- Title
-
Light directs zebrafish period2 expression via conserved D and E boxes
- Authors
- Vatine, G., Vallone, D., Appelbaum, L., Mracek, P., Ben-Moshe, Z., Lahiri, K., Gothilf, Y., and Foulkes, N.S.
- Source
- Full text @ PLoS Biol.
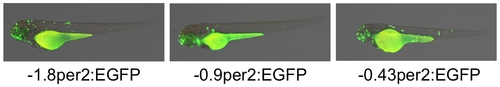
Transient expression of EGFP under the control of the per2 promoter. Representative photographs of 3 day(s) post-fertilization (dpf) microinjected larvae. Left panel: -1.8per2:EGFP construct was microinjected into zebrafish embryos. Ninety-four percent of injected embryos were EGFP-positive, exhibiting robust EGFP expression scattered throughout all tissues. Injection of -0.9per2:EGFP (middle panel) and -0.43per2:EGFP (right panel) embryos resulted in similar percentages of EGFP-positives, expression patterns, and intensities. |
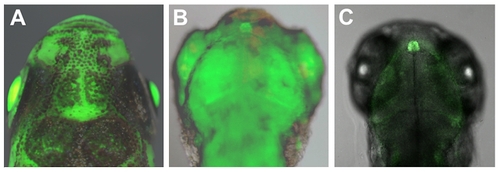
EGFP expression in Tg(–0.43per2:EGFP)tlv1. The per2 minimal promoter drives an EGFP expression throughout all tissues that is augmented in the pineal gland. Transgenic Tg(-0.43per2:EGFP)tlv1 adult (A) and 3 dpf larva (B) under a stereo dissecting microscope. 2 dpf embryo (C) under a confocal microscope. See also Video S1 and Figure S1. |
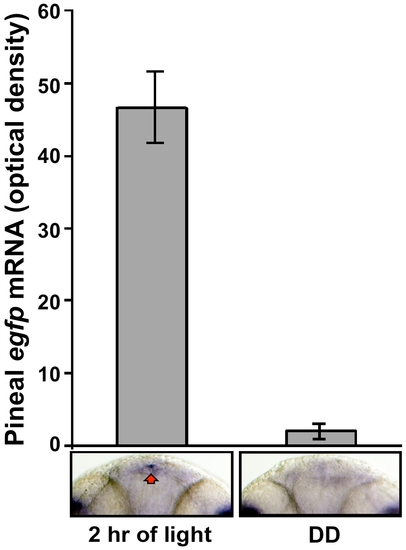
The per2 minimal promoter is light-induced in vivo: quantification of pineal EGFP mRNA levels. Tg(-0.43per2:EGFP)tlv1 embryos were entrained by exposure to two LD cycles. At the beginning of the third day of development, embryos were either exposed to light or kept in darkness. After 2 h (ZT 2 and CT 2) embryos were fixed and subjected to whole mount ISH for egfp mRNA. Signal intensities, determined using ImageJ software, revealed a 22-fold increase in pineal egfp mRNA levels after a 2 h light pulse (n = 16, p<0.01 by ANOVA) relative to pineal egfp expression in the DD controls. Error bars represent SE. Dorsal views of representative whole mounts are shown below. |
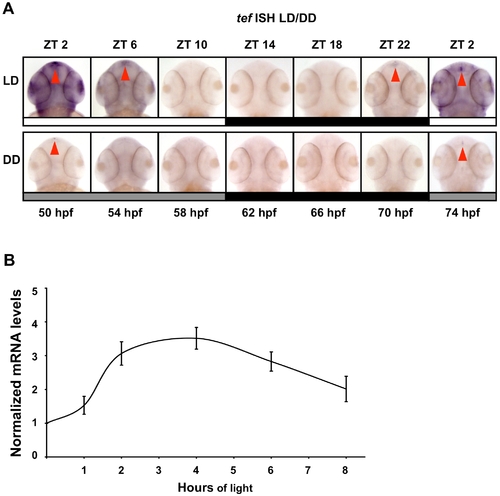
Temporal and spatial expression pattern of TEF under LD and DD cycles. (A) During the first 2 d of development, embryos were exposed to LD cycles. During the third and fourth days of development, embryos were kept under LD or under DD, sampled at 4 h intervals (50–74 hpf), and subjected to whole mount ISH for tef (Genebank Accession number U43671). White bars represent light phase, black bars represent dark phase, and gray bars represent subjective day (ZT, zeitgeber time). Red arrows indicate expression in the pineal gland. Tef is expressed throughout the body and cranial areas with augmented expression in the pineal gland and exhibits a circadian expression pattern with higher levels at the beginning of the subjective day (DD). Under LD, tef expression increases before lights on (ZT 2) and the amplitude of rhythmicity increases. (B) PAC-2 cells were maintained for 5 d in DD. Subsequently, total RNA was extracted from cells kept in darkness or exposed to light for different time periods (1, 2, 4, 6, 8 h). Quantification of tef mRNA levels was performed using qRT-PCR. The mRNA levels in each sample are expressed relative to the level of cells kept in DD. Values shown are the mean from three independent cell pools. Error bars represent SE. These results indicate that tef mRNA levels increase following exposure to light, peaking at 4 h of exposure. Statistical analysis was performed by one sample t-test. All light-treated samples showed significantly higher tef mRNA expression levels relative to DD controls. EXPRESSION / LABELING:
|
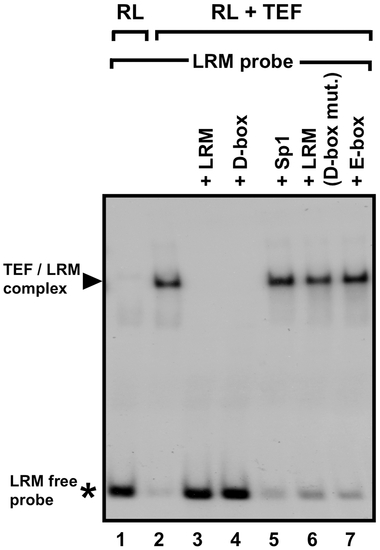
In vitro binding of TEF to the LRM D-box in an EMSA assay. A 32P-labeled LRM probe was incubated with in vitro–synthesized TEF protein, in the presence or absence of specific unlabeled competitor DNAs. Reticulocyte lysate (RL) alone was used as a control for unspecific binding between RL proteins and the probe (Lane 1). Then TEF without competitor (Lane 2), TEF with the LRM as competitor (Lane 3), TEF with the LRM D-box as competitor (Lane 4), TEF with an Sp1 site as competitor (Lane 5), TEF with an LRM probe carrying a mutated D-box as competitor (Lane 6), and TEF with the LRM E-box as competitor (Lane 7). Black arrow indicates the TEF/LRM complex. An asterisk indicates the free LRM probe. These results indicate that TEF binds to the LRM-D-box. |
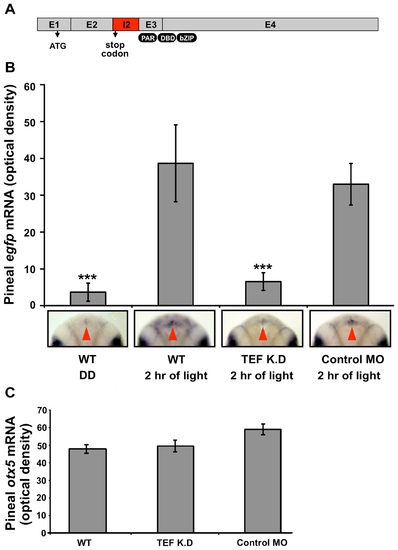
TEF is required for the light-induced per2 promoter activation in vivo. Transgenic Tg(-0.43per2:EGFP)tlv1 embryos were injected with tef-MO or control MO. Injected and uninjected embryos were entrained for two LD cycles. At the beginning of the third day of development, embryos were either exposed to light or kept in darkness. After 2 h (ZT 2) embryos were fixed and subjected to whole mount ISH for egfp or otx5 mRNA. (A) Tef (E2I2) MO injection altered tef mRNA splicing. Sequence analysis of the PCR products indicate that tef (E2I2) MO caused the integration of the 226 nucleotides of intron 2, which creates a premature stop-codon (at position +1,303), generating a truncated, non-functional protein lacking the proline and acidic amino acid-rich region (PAR), DNA binding domain (DBD), and the basic leucine zipper domain (bZIP). Grey boxes represent exons, and a red box represents the integrated intron 2. Translation start site and integrated stop codon are marked by arrows. (B) Signal intensities, determined using ImageJ software, revealed a ∼10-fold increase in pineal egfp mRNA levels after a 2 h light pulse in uninjected (n = 20, p<0.001) and control MO injected (n = 16, p<0.001) embryos (see also Figure 3). Tef-MO-injected embryos (n = 22) showed no significant increase in pineal signal after a 2 h light pulse suggesting that tef is required for the light-induced expression driven by the -0.43per2 promoter. Error bars represent SE. Dorsal views of representative whole mounts are shown below. Red arrows indicate the location of the pineal gland. (C) Pineal zotx5 mRNA levels of tef-MO injected, control-MO-injected, and uninjected transgenic embryos were similar, indicating that the injected MOs did not affect the development of the pineal gland. Statistical analysis was performed by Kruskal-Wallis test followed by Mann-Whitney test. EXPRESSION / LABELING:
|
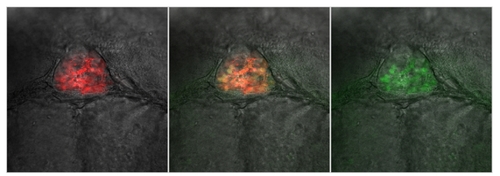
Co-localization of per2- and aanat2-driven expression in the pineal gland. A double transgenic line was generated by crossing Tg(-0.43per2:EGFP)tlv1 with Tg(aanat2:mRFP)y164, which exhibits red fluorescence specifically in the melatonin producing photoreceptor cells of the pineal gland. Confocal in vivo analysis reveals co-localized EGFP and mRFP expression in the pineal gland. mRFP (left panel), EGFP (right panel), and co-localized (middle panel) expression in the pineal gland are displayed in the figure. EXPRESSION / LABELING:
|