
- Title
-
Zebrafish grainyhead-like1 is a common marker of different non-keratinocyte epidermal cell lineages, which segregate from each other in a Foxi3-dependent manner
- Authors
- Jänicke, M., Renisch, B., and Hammerschmidt, M.
- Source
- Full text @ Int. J. Dev. Biol.

Of all zebrafish grhl-cp2 homologs, only grhl1 and grhl3 display specific expression in the embryonic skin. All panels except (J) show whole mount in situ hybridisations of wildtype embryos at stages indicated in the upper right corner and probes indicated in the lower right corner (c, cells; s, somites; %, % epiboly). (A-I) Expression of grhl1; (E′′) control staining with sense probe. Black arrowheads in (C,D,H,L) point to the olfactory placodes. (E-E′′) High magnifications of the tail fin, with peridermal cells in focus (recognizable by their hexagonal shape). Black arrows point to staining in the superficial peridermal cells, the red arrow in (E′) to a single cell in the underlying basal epidermis that expresses high levels of grhl1. (K-L) Staining for grhl2a. (M-O′) Expression of grhl2b with an antisense (M-O) and sense probe (M′-O′). (P-T) Expression of grhl3, with (Q′) displaying a magnified view on the enveloping layer (future periderm; black arrows point to single cells) of the embryo shown in (Q). All panels except (F,H,K′ ,T) show lateral views with anterior/vegetal to the left. (F,H) Ventral views with anterior to the left; (K′) is a posterior view with dorsal up, and (T) shows a transverse section at the trunk level. (J) An unrooted phylogenetic tree based on positional variation within regions of sequences that aligned across all identified (boxed) and published Grainyhead/CP2 proteins using the neighborjoining algorithm. Bootstrap values in % based on 1000 replicates are indicated for the major branching points. Abbreviations: OP, otic placode; PH, pharynx; PN, pronephros. |
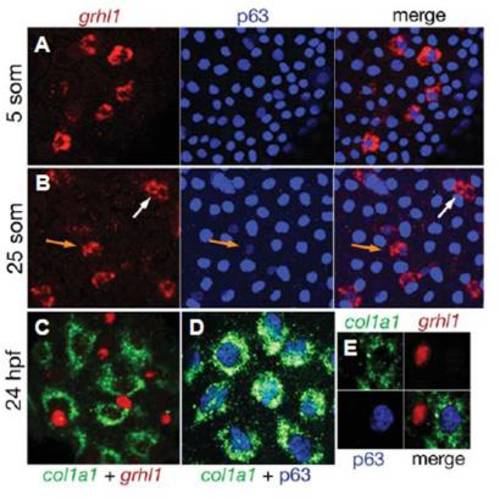
grhl1 is transiently expressed in a subset of epidermal precursors, but absent from differentiated basal keratinocytes. (A,B) Fluorescent in situ hybridisation for grhl1 (in red) combined with immunostaining for p63 (in blue). (C) Double fluorescent in situ hybridization for col1a1 (in green) andgrhl1 (in red). (D) Fluorescent in situ hybridisation for col1a1 (in green) combined with immunostaining for p63 (in blue). (E) A triple staining for col1a1 mRNA, grhl1 mRNA and p63 protein (three single channels plus merged image). For panels (C-E), embryos injected with grhl1 splice MO were used, leading to accumulation of grhl1 mRNA in the nucleus and facilitating the analysis of the obtained patterns (compare with Figs. 6 and S7). EXPRESSION / LABELING:
|
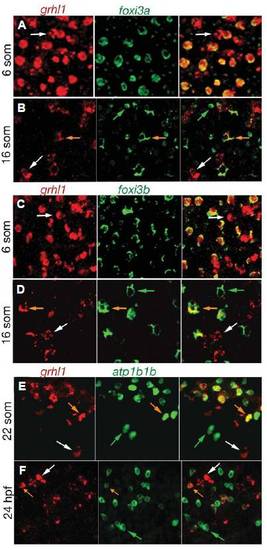
grhl1 is transiently expressed in ionocytes. All panels show double fluorescent in situ hybridisations with probes indicated above the panels. The right picture of each panel shows the merge of the two left pictures. Stages are indicated at the left. All panels show cells of wild-type embryos over the yolk sac (5 -16 som) or over the anterior half of the trunk (22 som - 24 hpf). White arrows mark cells expressing only grhl1, green arrows mark cells only expressing foxi3a (B), foxi3b (D), or atp1b1b (F), and orange arrows mark cells co-expressing the two indicated genes. EXPRESSION / LABELING:
|
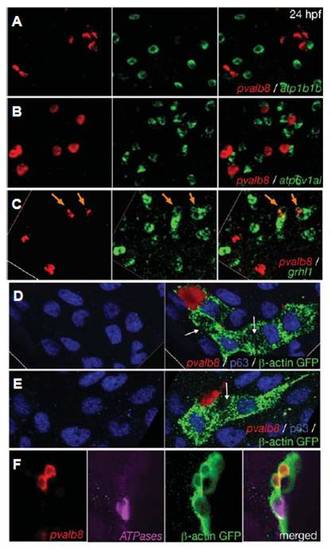
pvalb8-expressing cells are distinct from NaR and HR ionocytes, but also display transient grhl1 expression and derive from the common pool of epidermal progenitors. All panels show in situ hybridisations and/or immunostainings with the probes and antibodies indicated in lower right corners. (A,B) Double fluorescent in situ hybridisations of wild-type embryos at 24 hpf, revealing that pvalb8- positive cells lack expression of atp1b1b (A) and atp6v1al (B). (C) Double fluorescent in situ hybridisations of wild-type embryos at 24 hpf, revealing co-expression of grhl1 and pvalb8 in cells indicated by orange arrows. The left and middle pictures of each panel show the single channels of the merged image shown in the right picture. (D-F) Clones of epidermal cells of wild-type embryos at 24 hpf, after homotopic and homochronic transplantation of single GFP-transgenic cells into the ventral ectoderm at 6 hpf (shield stage). The left pictures of (D,E) show an anti-p63 immunostaining of keratinocytes (in blue), the right pictures show an overlay of the p63 immunostaining with an in situ hybridisation for pvalb8 transcripts (in red) and an anti-GFP immunostaining for the descendants of the transplanted cell (in green). The white arrows point to p63, pvalb8- double negative cells in the clone, which might represent an NaR or HR ionocyte. (F) From left to right: in situ hybridization for pvalb8 transcripts (in red), in situ hybridization for atp1b1b and atp6v1al transcripts (in pink), anti-GFP immunostaining for the descendants of the transplanted cell (in green), merged image. EXPRESSION / LABELING:
|
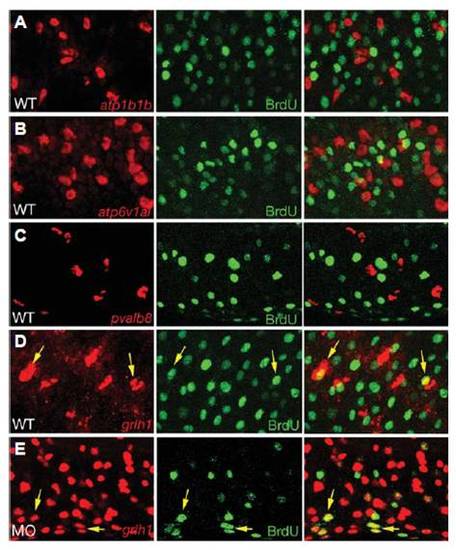
grhl1 is expressed in proliferating cells. All panels show confocal sections of embryos at 24 hpf that had been incubated with BrdU from 16 - 24 hpf, and after fluorescent in situ hybridization with probes indicated in red (left panels), and after anti-BrdU immunostaining (middle panels); right panels show merged images. (A-D) Wild-type embryos; (E) grhl1 morphant injected with splice-MO (compare with Fig. 6 and Supplementary Fig. S7). Yellow arrows in (D,E) point to grhl1, BrdU-double positive cells. Differentiated ionocytes and pvalb8-positive cells lack BrdU incorporation (A-C), whereas over one quarter of grhl1-positive cells have undergone DNA replication between 16 and 24 hpf (D) (<28%, 17.6±2.83 / 62±4.45, n = 10 sections). (E) In morphant embryos, the absolute number of grhl1-positive cells increases enormously (see also Fig. 6N), whereas the absolute number of grhl1, BrdU-positive cells remains similar (19.3±2.44 / 341±8.91, <5.5%, n = 10 sections), suggesting that the extra grhl1 cells represent differentiated non-keratinocyte epidermal cells, rather than their precursors. EXPRESSION / LABELING:
|
|
grhl1 transcription is controlled in an autoregulatory, timeand cell type-dependent matter. (A-M′) Lateral views (anterior/ventral to the left) of whole mount in situ hybridisations with probes indicated in the lower right corner. (H,J,K-M′) Cells at the anterior end of the trunk (H,K-M′) or at the head (J). (H) In situ hybridisation was followed by an immunostaining for p63. Stages are indicated in the upper right corner and genotypes in the lower left corner and apply to all panels left. MO indicates grhl1 morphants. Orange arrows in 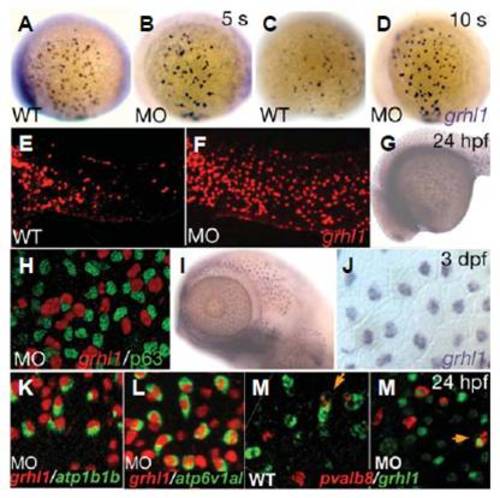
EXPRESSION / LABELING:
|
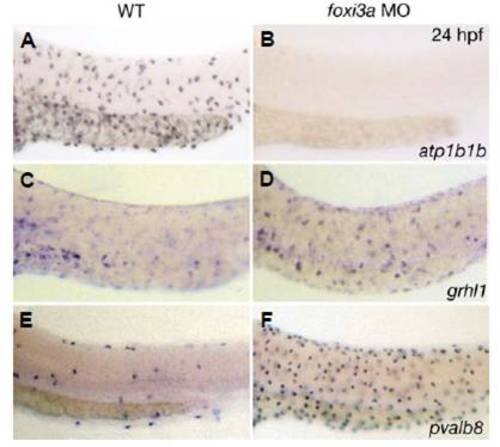
Loss of foxi3a function causes loss of ionocytes and an expansion of pvalb8-positive cells, while the number of grhl1- positive cells remains unaltered. All panels show whole mount in situ hybridisations at 24 hpf with probes indicated in the lower right corner; (A,C,E) un-injected controls; (B,D,F) foxi3a morphants. Anterior is to the left, dorsal up. |
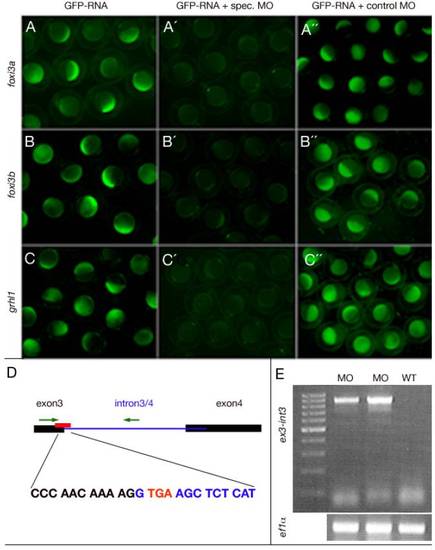
Efficacy controls of used ATG- and splice grhl1 morpholinos. (A-C) Live embryos at late blastula stages that were injected with constructs indicated at the top for genes indicated at the left side. These images show that the three ATG-MOs targeted specifically and efficiently the sequence they were designed against. (D) Graphical illustration of the grhl1-splice MO targeting site and the primer binding sites used to control the efficacy. (E) The grhl1-splice MO interfered with splicing of intron3-4, indicated by the RT-PCR amplification of an exon3-intron3/4 fragment from morphant (MO), but not from uninjected control WT embryos (WT). In reverse, a combination of an exon3 and an exon4 primer only gave an RT-PCR amplification product from WT, but not from morphant embryos (data not shown). Intron3/4 contains an in frame stop codon after the third exon (highlighted in red in D), which will yield a C-terminally truncated Grhl1 protein. |
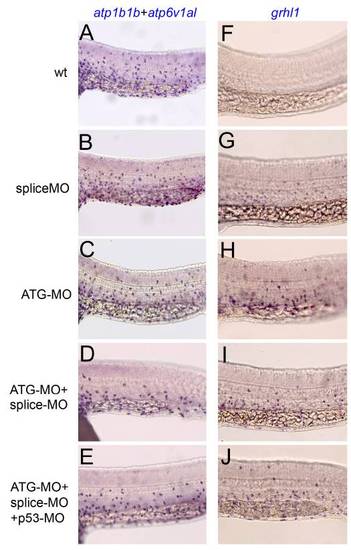
Embryos singly injected with grhl1 splice or ATG-MO, and embryos co-injected with both, are similarly affected. All panels show lateral views on the trunk of 24 hpf embryos at the level of the yolk tube, anterior to the left, after whole mount in situ hybridization with mixed atp1b1b and atp6v1al probes (left column) or with grhl1 probe (right column). (A,F) Uninjected control embryos; (B,G) embryos injected with grhl1 splice MO; (C,H) embryos injected with grhl1 ATG MO; (D,I) embryos co-injected with grhl1 splice and ATG MOs; (E,J) embryos co-injected with grhl1 splice MO, grhl1 ATG MO and p53 MO to suppress unspecific apoptotic effects. |
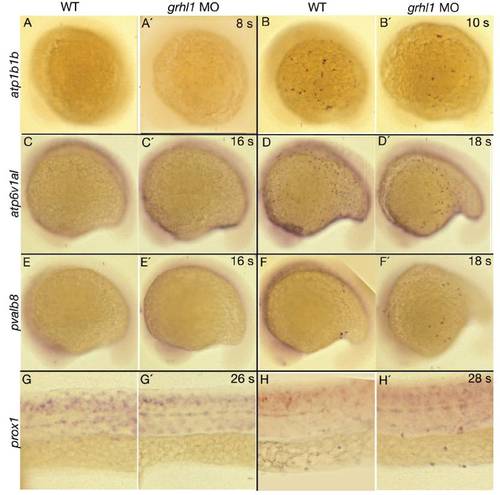
grhl1 morphants display unaltered onset of expression of genes marking the different non-keratinocyte epidermal cell lineages. All panels show lateral views (anterior to the left) of whole mount in situ hybridisations of wild-type siblings (WT, left columns) and grhl1 morphants (MO, right columns) with probes indicated at the left side and at stages indicated in the upper right corner (s = somites). (G-H′) The anterior part of the trunk. No difference in onset of expression could be detected between un-injected wild-type controls and morphant embryos. |
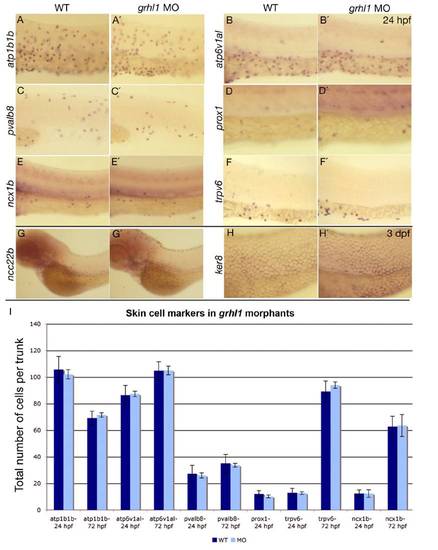
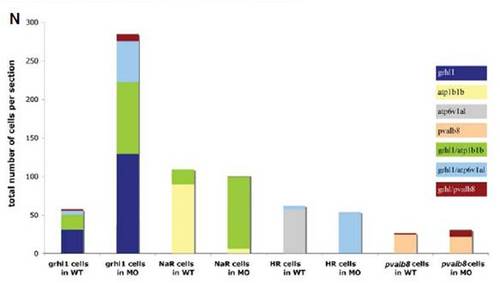
grhl1 morphants display unaltered numbers of the different known non-keratinocyte epidermal cell types. (A-H′) Lateral views of whole mount in situ hybridisations of WT (left columns) and grhl1 morphants (right columns) with probes indicated at the left side of the panels and at stages indicated in the upper right corner. All panels except (C,C′) show the anterior part of the trunk. (C,C′) The posterior part of the trunk. No differences in expression were detected between WT and morphants. (I) Graphical illustration of the average total numbers of cells expressing markers indicated below the bars. Dark grey bars show WT, light grey bars show grhl1 morphants. Error bars indicate the standard error of the mean. According to the Student-t test, none of the subtle differences seen was below the 0.01 level. |

Loss of grhl1 function does not affect skin morphology and osmoregulation. All panels show live fish; stages are indicated in upper right corner, genotypes and/or treatments in the lower left corners. (A-D) Wild-type (WT) or morphant fish grown in regular E3 medium (hypotonic; A-C) or in Ringers medium (isotonic; D). (E-F) Larvae after osmotic shock (see Materials and Methods for details). |
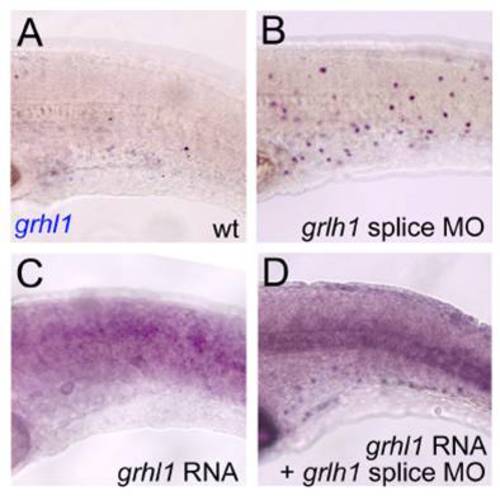
Injection of grhl1 mRNA leads to precocious loss of grhl1 expression in wild-type embryos, and to a normalisation of grhl1 expression in grhl1 morphant embryos. All panels show lateral views on trunk of embryos at 24 hpf, after in situ hybridisation with grhl1 probe. (A) Uninjected control; (B) embryo injected with grhl1 splice-MO; (C) embryo injected with grhl1 mRNA (20 ng/μl); (D) embryo coinjected with grhl1 MO and grhl1 mRNA. The weak ubiquitous staining in (C,D) is due to remnants of the injected synthetic mRNA. |
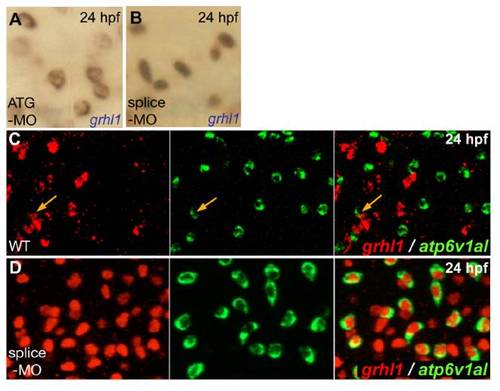
grhl1 morphants display grhl1 expression in all ionocytes, with nuclear localisation when grhl1-splice MO, and cytoplasmic localisation when grhl1-ATG MO is used. All panels show in situ hybridisations at 24 hpf and with probes indicated in lower right corners. (A,B) Grhl1 transcripts were located in the nucleus upon injection of grhl1-splice-MO (B; also used in D), whereas they were cytoplasmic when grhl1-ATG-MO was used (A). (C,D) Double fluorescent in situ hybridisations indicating that in wild-type embryos (WT), only few ATPase6v1al-positive ionocytes (in green) were grhl1-positive (in red) (C; orange arrows), whereas in the grhl1 morphant (D), all ATPase6v1al-positive ionocytes contained nuclear grhl1 transcripts; anterior trunk region; left and middle pictures show single channels, right picture merged image. |

Unillustrated author statements |