
- Title
-
Ptf1a is expressed transiently in all types of amacrine cells in the embryonic zebrafish retina
- Authors
- Jusuf, P.R., and Harris, W.A.
- Source
- Full text @ Neural Dev.
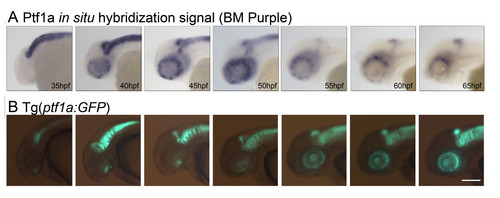
Comparison of endogenous ptf1a RNA expression and GFP reporter protein. Expression in wholemount transgenic zebrafish heads is shown at different ages (hours post-fertilization; times are identical in both panels). (A) Endogenous ptf1a RNA expression was revealed by in situ hybridization visualized by BM purple. (B) GFP reporter protein expression of Tg(ptf1a:GFP) embryos. Stable GFP expression follows endogenous RNA expression with a temporal delay of a few hours and is maintained. In contrast, endogenous RNA expression of ptf1a occurs relatively transiently and disappears from differentiated neural tissue by 65 hpf. At this age, it is only maintained in the ciliary margin of the eye, where neurons continue to develop throughout adulthood. Scale bar = 1 mm. |
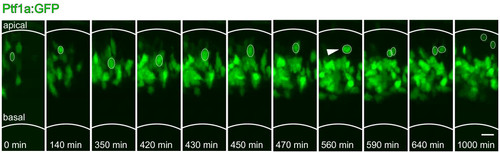
Temporal onset of Ptf1a expression in Tg(ptf1a:GFP). GFP-positive cells migrate to the centre of the neuroepithelium, where they form a wide band that will become the amacrine cell layer. Some cells (one example marked with white oval) move from this band back apically to the horizontal cell layer, where they undergo an additional division (white arrowhead shows mitosis). No cells are seen to move back to the apical surface and divide as would be expected from progenitor cells. Scale bar = 10 μm. |
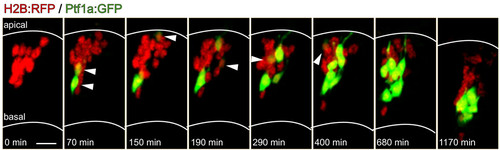
Ptf1a turns on in postmitotic differentiating cells. Time-lapse images from Additional file 1 (38 to 58 hpf) showing cells transplanted from a Tg(ptf1a:GFP)/H2B:RFP RNA-injected embryo to reveal individual cells. Some transplanted (red) cells turn on Ptf1a:GFP expression in the apical half (top) of the developing neuroepithelium, but not always at the apical surface. White arrowheads indicate cells that have turned on expression of Ptf1a:GFP in that frame. Location of cells indicated by white arrowheads reveal that Ptf1a:GFP in individual cells turns on at different stages of their migration (different depth between apical surface and developing amacrine layer in the middle of the neuroepithelium). Scale bar = 10 μm. |
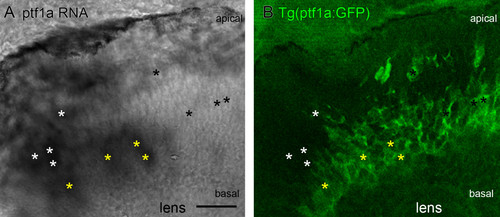
The transition from ptf1a RNA to ptf1a:GFP protein expression. Coronal section through Tg(ptf1a:GFP) embryos with in situ hybridization labelled endogenous ptf1a RNA expression at 48 hpf. (A) Endogenous ptf1a RNA expression as revealed by BM purple visualized in situ hybridization. Labelled cells are found near the apical surface and in the middle of the developing retinal neuroepithelium. (B) Tg(ptf1a:GFP) embryos show a large band of labelled cells in the centre of the neuroepithelium, where differentiating amacrine cells form part of the inner nuclear layer. A few labelled cells are found more apically, where horizontal cells make up the outermost layer of the inner nuclear layer. In some regions apical cells express only the endogenous ptf1a RNA, but not GFP (white asterisks), some co-express both (yellow asterisks), and cells already in the future amacrine layer primarily express only GFP (black asterisks). Scale bar = 20 μm. EXPRESSION / LABELING:
|
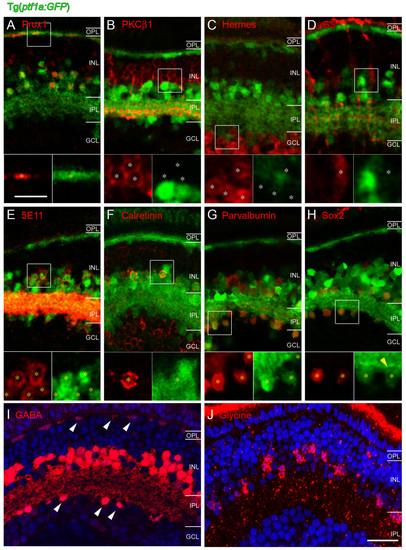
Immunohistochemical characterization of GFP-expressing cells in Tg(ptf1a:GFP) embryos at 120 hpf. Antibodies used are shown in each panel and appear in the red channel. Insets show higher magnification in which all red (antibody marker) cells are marked by asterisks. White asterisks show red cells that are Ptf1a:GFP negative (B-D), yellow asterisks show red cells that are Ptf1a:GFP positive (A, E-H). (A) All horizontal cells as identified by Prox1 immunoreactivity also express Ptf1a:GFP. Prox1 also weakly labels bipolar cells, which do not express Ptf1a:GFP and a subpopulation of amacrine cells, which does co-label with the Ptf1a:GFP. (B-D) Ptf1a:GFP expressing cells do not colocalise with the bipolar cell marker PKCβ1, the ganglion cell marker Hermes (including the displaced amacrine cells in the ganglion cell layer) nor the Müller cell-specific marker glutamine synthetase. (E-H) In contrast, Ptf1a:GFP-expressing amacrine cells colocalise with the pan-amacrine marker 5E11, and with the amacrine subpopulation markers calretinin, parvalbumin and Sox2. Calretinin (F) is also expressed in ganglion cells and does not label the displaced amacrine populations. (I, J) GABA and glycine staining in plastic sections reveal that some cells in the amacrine layer of the INL express GABA and some express glycine. Some cells in the outermost INL (horizontal cells) and ganglion cell layer (displaced amacrine cells) label with GABA (white arrowheads), but never glycine. The nuclear stain DAPI was used to label the retinal layers. GABA, γ-aminobutyric acid; GCL, ganglion cell layer; GS, glutamine synthetase; INL, inner nuclear layer; IPL, inner plexiform layer; OPL, outer plexiform layer; PKC, protein kinase C. Scale bar in (J) = 20 μm and applies to (A-J); scale bar in the inset of (A) = 10 μm and applies to insets in (A-H). EXPRESSION / LABELING:
|
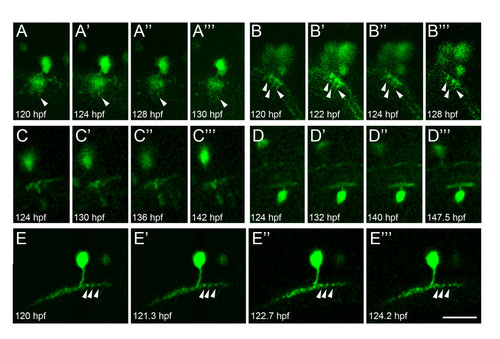
Ptf1a:GFP amacrine cells at 120 hpf have stable neurite arbors. Single time-lapse images of different amacrine cells imaged for up to 24 hours. The GFP signal is relatively weak in some cells but, nonetheless, the stratification depth extent and lateral neurite arbor width remain unchanged over the imaging period. In some brighter labelled cells, even individual branches or varicosities are seen to remain stable (white arrowheads), in contrast to the rapid neurite remodelling of amacrine cells, which has been previously described up till 73 hpf [29]. Scale bar = 20 μm. |
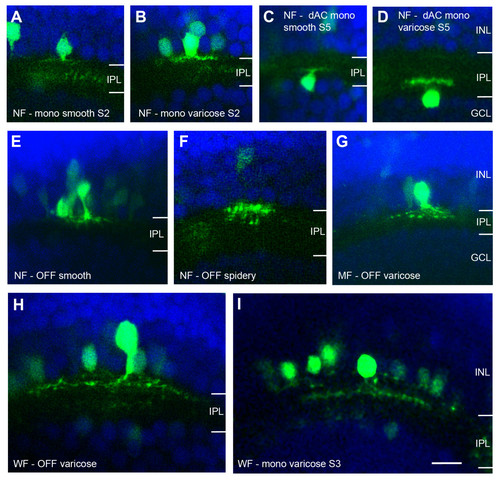
Morphology of different types of amacrine cells in Ptf1a:GFP DNA-injected embryos (120 hpf). Micrographs show single images or extended focus views to reveal most of the morphology of individual cells without interfering neurites from neighbouring labelled cells. The nuclear stain DAPI was used to reveal the retinal layers. Their somas are found in the inner half of the INL or in the GCL immediately adjacent to the IPL. Their neurites can be smooth or beaded (with varicosities) and differ in width, stratification depth, and stratification breadth. (A-F) Narrow-field (NF) amacrine cell type examples that are monostratified (A, B), displaced (somas in the GCL in (C, D)) and monostratified, or multistratified (E, F). (G) Medium-field (MF) amacrine cell with varicose processes stratifying throughout the OFF sublamina. (H, I) Examples of two wide-field (WF) amacrine cells stratifying broadly in the OFF sublamina (H) or narrowly in stratum 3 (I). dAC, displaced amacrine cell; GCL, ganglion cell layer; INL, inner nuclear layer; IPL, inner plexiform layer; mono, monostratified; S, stratum. Scale bar = 10 μm. |
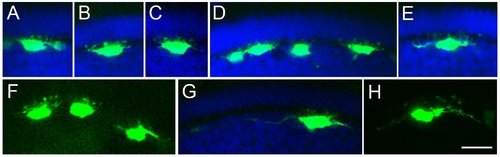
Morphology of example horizontal cells in Ptf1a:GFP DNA injected embryos (120 hpf). Micrographs showing single images or extended focus views. The nuclear stain DAPI was used to reveal the retinal layers. Horizontal cells have somas in the outer inner nuclear layer immediately adjacent to the outer plexiform layer. Different horizontal cell types have more or less elongated somas and the dendritic trees of different types can extend to form relatively smaller (for example, (A, B, C)) or larger (for example, (E, H)) arbors. Pattern of dendritic tips could not be distinguished in this vertical view and horizontal cells were not further classified, although based on the morphology shown in this vertical view, examples of the previously described types of horizontal cells could be found. Some well-labelled cells also had a distinct axon (G). Scale bar = 20 μm. |
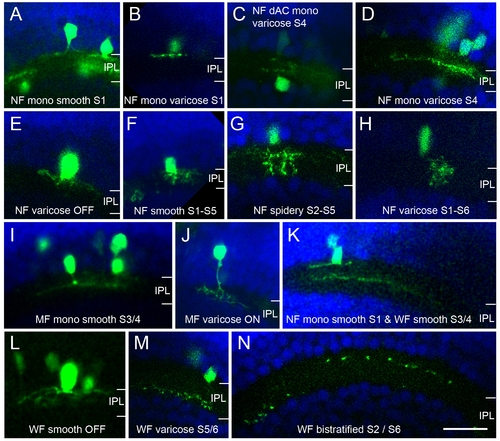
Morphology of additional types of amacrine cells in Ptf1a:GFP DNA-injected embryos (120 hpf). Micrographs show single images only and some of the joining neurites and/or somas are thus not in focus in the shown images. The nuclear stain DAPI was used to reveal the retinal layers. As described in Figure 7, different subtypes can be distinguished by the stratification depth, breadth, neurite arbor width and smooth or beaded neurite morphology. (A-H, K) Narrow-field amacrine cell types. (I, J) Medium-field amacrine cell types. (K-N) Wide-field amacrine cell types. dAC, displaced amacrine cell; IPL, inner plexiform layer; MF, medium-field; mono, monostratified; NF, narrow-field; WF, wide-field. Scale bar = 20 μm. |