
- Title
-
hnRNP I is required to generate the Ca2+ signal that causes egg activation in zebrafish
- Authors
- Mei, W., Lee, K.W., Marlow, F.L., Miller, A.L., and Mullins, M.C.
- Source
- Full text @ Development
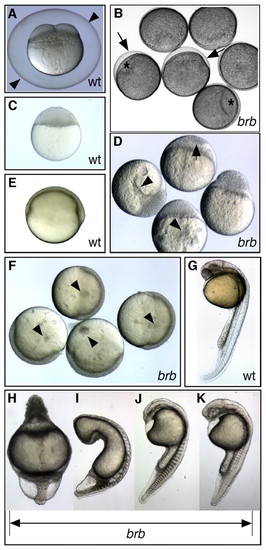
brom bones mutants display impaired egg activation and dorsoventral patterning defects. (A) Wild-type (wt) 4-cell-stage zebrafish embryo at 60 mpa, with a fully elevated chorion (arrowheads). (B) Failed chorion elevation (arrows) and cytoplasmic segregation in brom bones mutant (brb) eggs at 60 mpa. Mutants have small blastodiscs (*) and slightly opaque yolk. (C) A wild-type embryo at oblong stage (a midblastula stage). (D) Moderately affected mutant embryos exhibit incomplete cellularization (arrow) and display large cytoplasmic inclusions in the yolk (arrowheads) at oblong stage. (E,F) Small cytoplasmic inclusions (arrowheads) are visible in the yolk of mildly affected mutant embryos (F) at gastrula stages, but not in wild-type embryos (E). (G) Wild-type embryo at 1 dpf. (H) Radially ventralized brom bones mutant embryo and (I-K) brom bones mutant embryos with decreasing strength of ventralization at 1 dpf. G-K are dissecting microscope images; rostral is towards the top and dorsal is to the right. |
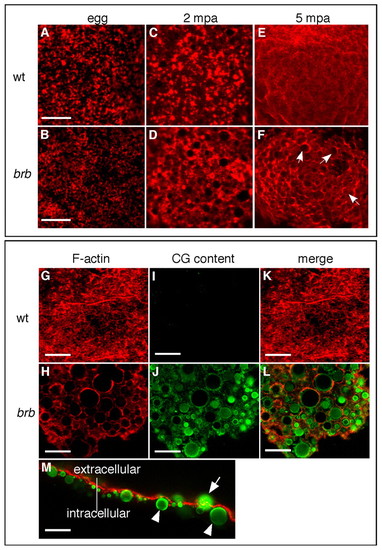
CGE is defective in brom bones mutants. (A,B)F-actin distribution in wild-type (A) and brom bones mutant (B; 100%, n=28) zebrafish eggs prior to egg activation. (C,E) F-actin distribution in wild-type eggs at 2 (C) and 5 (E) mpa. (D,F) Abnormal F-actin distribution in brom bones mutant eggs at 2 (71%, n=35) and 5 (77%, n=49) mpa. The remaining mutant eggs showed F-actin distribution similar to wild-type eggs. Arrows in F highlight some of the circular profiles evident in mutant eggs. (G-L) F-actin (red) and CG content (green) distribution in wild-type (G,I,K) and brom bones mutant (H,J,L) eggs at 30 mpa (100%, n=71 brom bones mutant eggs). (M) Lateral view of a mutant egg surface at 5 mpa shows the localization of CG cores with respect to the F-actin meshwork. Arrow indicates a non-exocytosed granule within the F-actin meshwork; arrowheads indicate non-exocytosed granules beneath the F-actin meshwork. C-F are 20x magnification images; A-L are z-stacks of confocal images, M is a single confocal section. Scale bars: 10 μm in A,B; 20 μm in G-M. PHENOTYPE:
|
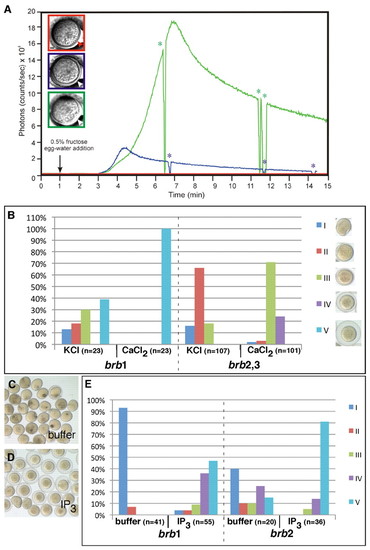
Reduced Ca2+ wave causes egg activation defects in brom bones that is rescued by either Ca2+ or IP3. (A) Representative profiles of luminescence from aequorin-loaded zebrafish eggs (red: strongly affected brom bones mutant egg; blue: moderately affected mutant egg; green: mildly affected mutant egg). The profiles illustrate the total luminescent output for the entire activation process with a temporal resolution of 1 second. Arrow indicates the addition of 0.5% fructose in egg water to the egg-injection chamber to activate the eggs. Asterisks indicate the time window when the photon counting was suspended and a bright-field image of the egg was taken. Bright-field images show the egg morphology after activation, with the color of the box outline corresponding to the luminescence profile. Arrowheads indicate the degree of chorion elevation after activation. Scale bar: 100 μm. (B) Calcium injection rescues the egg activation defects in brom bones mutants. The degree of egg activation was examined after injection of KCl (control) or CaCl2 into brom bones eggs. brb1, brb2 and brb3 were three brom bones mutant females that produced eggs in this experiment. Eggs from brb2 and brb3 showed a similar range of phenotype and rescue, and were therefore combined for simplicity. The egg activation phenotype was scored as a percentage of the total number of eggs, with the strength of egg activation divided into five classes (shown in the bright-field images, right). (C-E)IP3 injection rescues the egg activation defects in brom bones mutants. (C,D) Eggs from a single clutch at 60 mpa after injection of buffer (C) or IP3 (D). (E) Percentages of eggs showing different degrees of egg activation after injection of buffer or IP3. brb1 and brb2 were two mutant females that produced eggs for this experiment and are different from the females in B. PHENOTYPE:
|
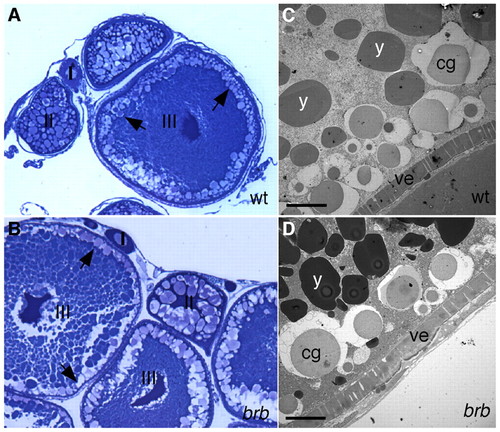
Oogenesis appears normal in brom bones mutant females. (A,B) Stages I to III of oogenesis appear normal in brom bones mutant females (B, n=3 ovaries). Arrows indicate the location of CGs. (C,D) Transmission electron micrographs of stage IV oocytes. The morphology of cortical granules (cg), yolk globules (y) and vitelline envelope (ve) appear similar in wild-type (C) and mutant (D) oocytes. Scale bar: 10 μm. |
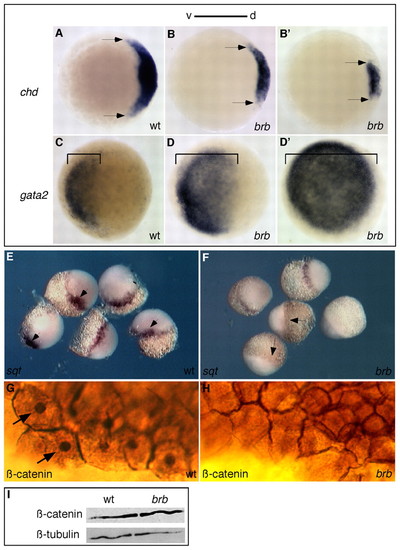
Dorsal axis disruption in brom bones mutant embryos. (A-F) Dorsal gene expression is reduced and ventral gene expression is expanded in brom bones mutant zebrafish embryos, as revealed by whole-mount in situ hybridization. Compared with wild type (A), chordin is variably reduced at 50% epiboly in brom bones mutants (B): 24% showed moderately reduced (B), 24% showed strongly reduced (B′), 25% had absent and 27% had normal (data not shown) chordin expression (n=59). Arrows mark lateral extent of expression. (C-D′) Compared with wild type (C), gata2 showed variable expansion in ventral tissue (denoted by brackets) in brom bones mutants at 50% epiboly: 25% showed partial expansion (D), 39% showed complete expansion (D′) and 36% had normal (data not shown) gata2 expression (n=51). squint expression marks the future dorsal side at midblastula stages in wild-type embryos (E, arrows), but was absent (F, arrows; 29%), severely reduced (38%) or normal (33%, data not shown) in brom bones mutant embryos (n=45). (G,H) β-catenin protein is present in the nuclei (arrows) and at the plasma membrane in wild-type embryos (G), but was only present at the plasma membrane of brom bones mutant embryos (H, 29%, n=52). The remaining mutant embryos showed either a reduced (42%) or normal (29%) domain of nuclear-localized β-catenin (data not shown). (I) Western blot of 1-cell-stage lysates shows that β-catenin protein abundance was not affected in brom bones mutants. β-tubulin is a loading control. d, dorsal; v, ventral. EXPRESSION / LABELING:
PHENOTYPE:
|
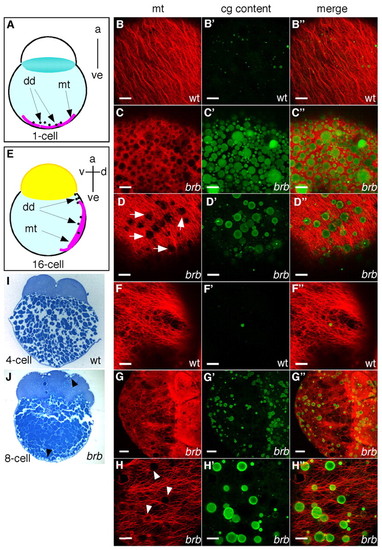
brom bones mutants display cortical microtubule defects associated with impaired CGE. (A,E) Schematic diagrams showing parallel arrays of microtubules in the vegetal cortex at the 1-cell stage (A) and in the lateral yolk cytoplasmic layer at the 16-cell stage (E). (B-D″,F-H″) Zebrafish embryos were double-stained to show microtubules (red) and CG contents (green). Confocal image stacks of 6 μm (B-F″,H-H″) and 80 μm (G-G″). (B-D″) Embryos at 20 mpf; vegetal pole views. (B-B″) Microtubules and traces of CG content in wild-type embryos (n=22). Microtubules and persisting CGs in severely affected (C-C″, 16%, n=88) and intermediately affected (D-D″, 57%) brom bones mutant embryos. The remaining mutant embryos showed similar microtubule arrays to wild type (27%, data not shown). (F-H″) Embryos at the 16-cell-stage; lateral views. (F-F″) Cortical microtubules in wild-type embryos (n=35). (G-G″) In brom bones mutants the microtubule network was disrupted by circular profiles, which correspond to non-exocytosed CGs (71%, n=80 mutant embryos). The remaining mutant embryos showed a normal microtubule network (29%, data not shown). (H-H″) Observation at high magnification shows that the circular profiles (arrowheads) interrupting the long microtubule arrays in mutant embryos are CGs. (I,J) CGs were not observed in wild-type embryos during early cleavage stages (I), but were found in mutant embryos beneath the plasma membrane (J, arrowheads). Sagittal histological sections (5 μm) were stained with Toluidine Blue to show CGs. a, animal pole; ve, vegetal pole; d, dorsal; v, ventral; dd, dorsal determinant; mt, microtubules. Scale bars: 20 μm in B-F″,H-H″; 50 μm in G-G″. |
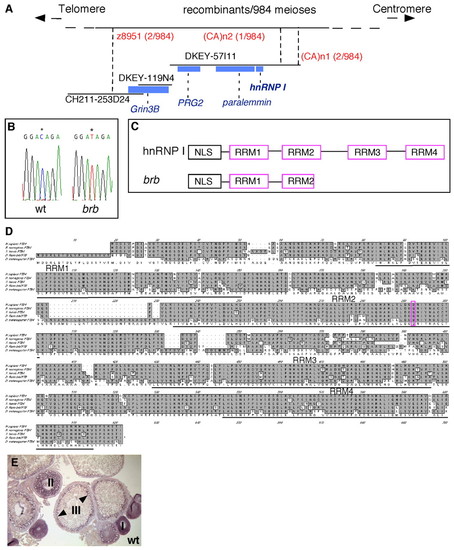
Positional cloning reveals that brom bones encodes the RNA-binding protein, hnRNP I. (A) Genetic/physical map across the brom bones interval on chromosome 2. CH211-253D24, DKEY-119N4 and DKEY-57I11 are three sequenced and overlapping BAC clones in this interval. (CA)n1 and (CA)n2 are polymorphic markers we identified in BAC clone DKEY-57I11. Four transcription units were predicted based on the BAC sequence between z8951 and (CA)n2: grin3b, prg2, paralemmin and hnrnp I. Blue boxes indicate sizes and locations of these genes relative to the BAC clones. (B) Sequencing of wild-type and brom bones alleles revealed a cytosine to thymidine transition (*) in the open reading frame of the hnrnp I gene, which produces a premature stop codon. (C) Schematic diagram showing the protein domain structures of hnrnp I and brom bones. (D) Amino acid sequence alignment of hnRNP I homologs in (top to bottom) human (AAP35465), rat (Q00438), Xenopus (AAF00041), zebrafish (AAH95372) and Drosophila (NP_524703). The residue that is mutated to a stop codon in brom bones (purple) and the RRM domains are highlighted. (E) hnrnp I is expressed during oogenesis as revealed by in situ hybridization on wild-type ovary sections (arrowheads show cortical enrichment in stage III oocytes). |
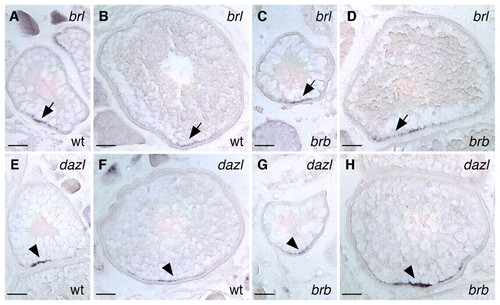
Polarized RNA localization is unaffected in brom bones oocytes. Vegetally localized brl transcripts (arrows) in wild-type (A,B) and brom bones (C,D) zebrafish oocytes. Vegetally localized dazl transcripts (arrowheads) in wild-type (E,F) and brom bones (G,H) mutant oocytes. Stage II (A,C,E,G) and stage III (B,D,F,H) oocytes are shown. In situ hybridization was performed on sections (10 μm) of dissected ovaries. Scale bars: 50 μm. EXPRESSION / LABELING:
|

Unillustrated author statements |