
- Title
-
Small molecule screen for compounds that affect vascular development in the zebrafish retina
- Authors
- Kitambi, S.S., McCulloch, K.J., Peterson, R.T., and Malicki, J.J.
- Source
- Full text @ Mech. Dev.
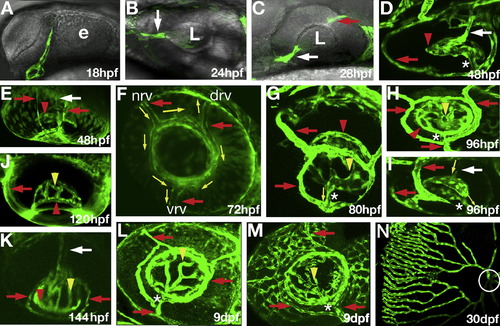
Early development of retinal vasculature in zebrafish. Confocal images of GFP expression in the eyes of fli1:EGFP (B, E, F, J, and K) and flk1:GFP (A, C, D, G, H, I, L, M, and N) transgenic zebrafish. The retinal artery or its presumptive primordium are indicated by white arrows. Red arrows point to the surface vasculature. Red arrowheads indicate the intraocular ring vessel. Yellow arrowheads indicate the intraocular vessel network, whereas the connection between the intraocular and surface vessels is indicated by asterisks. Yellow arrows show the direction of blood flow. (A) GFP-expressing cells are absent the eye at 18 hpf. (B) GFP-positive cells are seen in the retina by 24 hpf (B, white arrow). (C) By 28 hpf, GFP-positive cells are seen in the choroid fissure (white arrow), behind the lens, and in the posterior grove (red arrow). (D and E) By 48 hpf, GFP-positive cells form a network of vessels around the medial side of the lens, annular collection duct (asterisk) is established, and surface vessels are differentiated. Retinal blood flow is present by 72 hpf. (F) In the surface vasculature, blood enters through the nasal vessel (nrv) and exits through the dorsal (drv) and ventral (vrv) vessels. (G–I) Blood from the intraocular vasculature flows through the annular collection duct (asterisks) into the surface vessels. (J and K) Intraocular vessels gradually rearrange to form a roughly radial array by 144 hpf. (L) Intraocular and surface vasculatures at 9 dpf. (M) Choriodal vessels form a network on the outer surface of the eye at 9 dpf. (N) The eye vasculature at 30 dpf. Circle indicates the optic disc region. The retina was dissected and mounted on a flat surface to obtain this image. e, optic lobe; L, lens. In (A–M) anterior is left. In (A–C, G, H, L, F, M, and N) dorsal is up. Panels (A–C, F, H, L, and M) show roughly the lateral view of the eye. Panels (D, E, I, J, and K) show ventral view of the eye. EXPRESSION / LABELING:
|
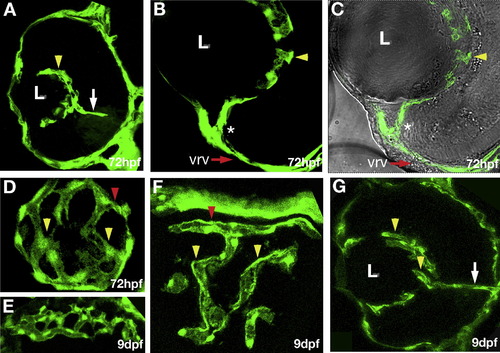
Characterization of early retinal vasculature. Confocal images of cryosections through eyes of fli1:EGFP transgenic animals. (A–C) Transverse sections through the retina. Intraocular vessels (yellow arrowheads) wrap around the lens, and are connected to the surface vessel (asterisk) at 72 hpf. Dorsal is up and lateral to the left. (D) A somewhat oblique longitudinal section through the region behind the lens reveals a vessel network on the surface of the lens. Posterior is to the right, lateral is down. (E) A transverse tangential section through the rostral eye showing the choriodal vessel network at 9 dpf. (F) A transverse section tangential to the lens showing the intraocular ring vessel (red arrowhead) and the intraocular vessel network (yellow arrowheads) at 9 dpf. (G) A transverse section showing intraocular vessels at 9 dpf, dorsal is up, and lateral to the left. The retinal artery is indicated by white arrow. EXPRESSION / LABELING:
|
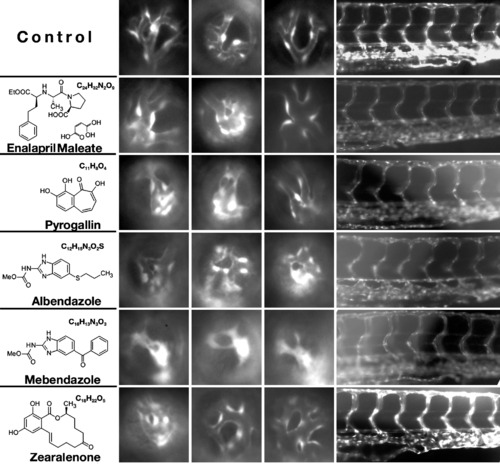
Phenotypic changes in the retinal vasculature following treatment with different chemicals. Shown are lateral views of the retinal vasculature through the lens at 96 hpf (3 left-most columns of images), as well as lateral views of the trunk vasculature (right-most column of images, dorsal is up). Each row shows three examples of the phenotype induced in the retina and one example of trunk phenotype. Note that in the most extreme cases, vessels are not observed at all and GFP-positive tissue forms irregular clumps. Such clumps of tissue are not counted as vessel segments in graphs presented in Fig. 4. The name, formula, and the structure of each chemical are provided to the left of image panels. |
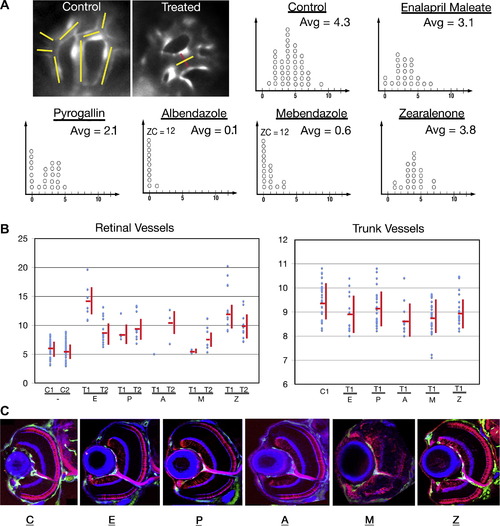
The number and thickness of retinal and trunk vessels following treatment with different chemicals. (A) Top left image panels illustrate the method of counting and measuring vessels. In the control image panel, yellow lines indicate the vessel segments. The image of a treated retina shows an example of vessel segment thickness measurement (the line in red indicates thickness). Graphs in panel A show the number of ocular vessel segments in control and chemically treated animals. x-axis provides the number of vessel segments per eye; each circle represents a single retina. Retinae with absent or collapsed vessels only are given the value of 0. The average number of blood vessel segments (Avg) per eye is provided in the upper left corner of each graph. In cases where the number of retinae in the zero category exceeds 10, its size is provided numerically as ZC (zero category). In this experiment, for each compound, we chose the highest concentration that is known to produce retinal blood vessel changes but does not affect trunk vasculature (Mebendazole) or retinal lamination (enalapril maleate, pyrogallin, albendazole, and zearalenone). (B) Vessel thickness measurements in control and chemically treated embryos. Untreated controls are indicated as C1 and C2, while small molecule tests as T1 and T2. T1 represents the highest concentration producing eye-specific vasculature phenotype that does not cause a disorganization of the retina and T2 represents the lowest concentration sufficient to produce an eye vasculature phenotype. In the case of mebendazole, neuronal organization is affected at all concentrations tested, and so we provide data for the highest concentration that affects the eye but not the trunk vasculature. Statistical significance was evaluated for T1 and T2 concentrations of each compound: Enalapril maleate: p < 0.001 for T1, p < 0.001 for T2; Pyrogallin: p value not significant for T1, p < 0.001 for T2; albendazole: p not significant for both T1 and T2, most likely due to small sample size, Mebendazole: p not significant for T1, p < 0.05 for T2; Zearalenone: p < 0001 for T1, p < 0.001 for T2. Trunk vessel thickness is provided for the T1 treatment only. The trunk vessel thickness measurements also yielded statistically significant values for albendazole p < 0.01 and mebendazole p < 0.001. (C) Confocal images of transverse sections through control and chemically treated retinae, showing the organization of neuronal layers. Retinal ganglion cells including the optic nerve, and photoreceptors are visualized with Zn-8 and Zpr-1 antibodies, respectively (both in red) and intraocular vessels are marked by GFP expression (green). To visualize plexiform layers, sections were counterstained with fluorophore-conjugated phalloidin (blue). The concentrations of chemicals used for experiments shown in these panels are indicated in Table 1 in italics. |
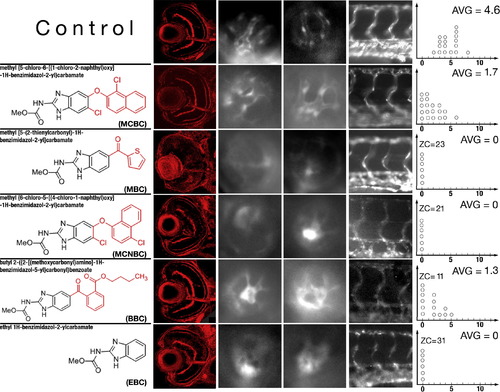
Phenotypic changes produced by compounds structurally similar to albendazole and mebendazole. The left-most column of image panels shows transverse sections through control and chemically treated retinae. The concentrations of chemicals used for experiments shown in these panels are indicated in Table 2 in italics. Panels in the middle two columns of images show lateral views of the retinal vasculature through the lens at 96 hpf. The right-most column of images shows lateral views of the trunk vasculature. Graphs to the right are plotted as in Fig. 4. In all images, dorsal is up and anterior is left. |
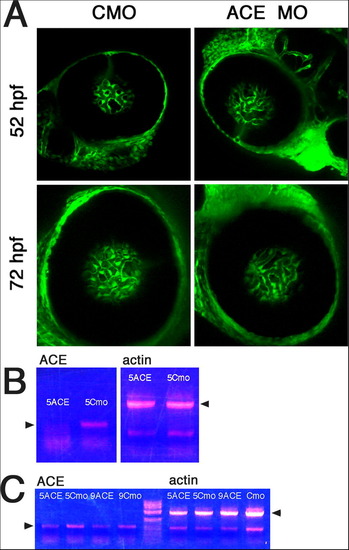
Analysis of retinal vasculature in ACE knockdown animals. (A) Confocal images of retinae from flk-GFP transgenic animals treated with anti-ACE or control (CMO) morpholinos. Lateral views are provided of representative retinae from four independent experiments. (B) RT-PCR analysis of knockdown efficiency at 24 hpf. 5 μg/μl of morpholino was used in this experiment. (C) RT-PCR analysis of knockdown efficiency at 48 hpf. Two morpholino concentrations were used: 5 and 9 μg/μl. The amplification of actin mRNA was used to control the amount and the quality of RNA extracted from morphant and control animals. Arrowheads indicate relevant amplification products. PHENOTYPE:
|
Reprinted from Mechanisms of Development, 126(5-6), Kitambi, S.S., McCulloch, K.J., Peterson, R.T., and Malicki, J.J., Small molecule screen for compounds that affect vascular development in the zebrafish retina, 464-477, Copyright (2009) with permission from Elsevier. Full text @ Mech. Dev.