
- Title
-
Isolation of a ventricle-specific promoter for the zebrafish ventricular myosin heavy chain (vmhc) gene and its regulation by GATA factors during embryonic heart development
- Authors
- Park, J.S., Kim, H.S., Kim, J.D., Seo, J., Chung, K.S., Lee, H.S., Huh, T.L., Jo, I., and Kim, Y.O.
- Source
- Full text @ Dev. Dyn.
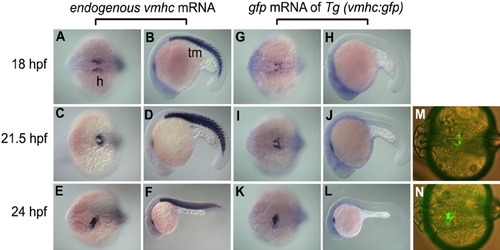
Identical expression pattern of green fluorescent protein (GFP) reporter gene by vmhc promoter to endogenous vmhc mRNA in the heart region at the early heart-forming stage. A,C,E: Expression patterns of endogenous vmhc mRNA are shown in heart region at 18, 21.5, 24 hours postfertilization (hpf)each. Dorsal views with anterior to the left. B,D,F: Endogenous vmhc transcripts are observed in trunk muscle. Lateral view with anterior to the left. G,I,K: Expression patterns of gfp mRNA are observed in the heart region. Dorsal views with anterior to the left. H,J,L: No gfp transcript is observed in the trunk region. Lateral view with anterior to the left. M,N: GFP fluorescence signals from transgenic zebrafish embryos in heart region at 21.5 and 24 hpf. Dorsal views with anterior to the left. h, heart; tm, trunk muscle. EXPRESSION / LABELING:
PHENOTYPE:
|
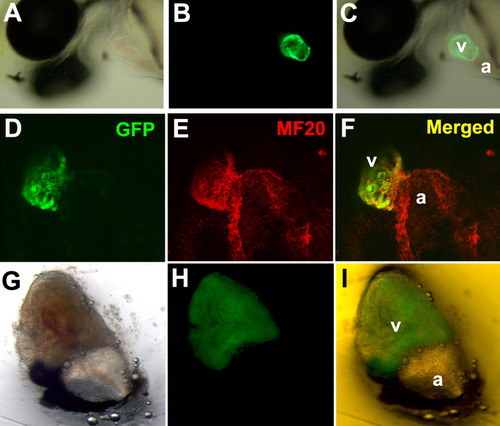
Ventricle-specific expression of the green fluorescent protein (GFP) reporter gene using the 5′-flanking region of vmhc as a promoter. Transgenic zebrafish embryo at 48 hours postfertilization (hpf). A: Nomarski image. B: Ventricle-specific green fluorescent signal. C: Overlay. Confocal-microscopic (Zeiss) images of the 48-hpf transgenic embryo immunostained with myocardium-specific MF20 monoclonal antibody followed by the Alexa594 secondary antibody. D-F: Ventral heart view with green fluorescent signal at the ventricular region (D), red (E), overlay (F). G: Isolated heart from 2 months after fertilization using a Leica fluorescence stereomicroscope. H,I: Brightfield, green fluorescent signal in the ventricular region (H), overlay (I). Views of the embryos are lateral and anterior to the left. a, atrium; v, ventricle. EXPRESSION / LABELING:
|
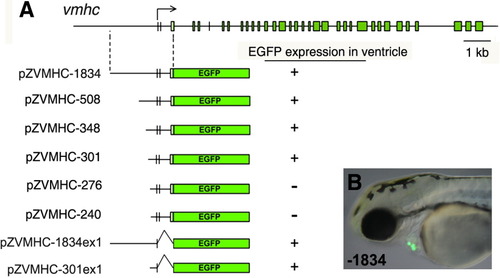
Promoter analysis using transient expression of the green fluorescent protein (GFP) reporter gene. A: Schematic drawing of the vmhc gene structure. The vertical lines and rectangles represent exons. The horizontal thin line separating exons represents the introns. An enhanced GFP (EGFP) reporter gene was fused to the third exon of the zebrafish vmhc 5′-flanking region, which includes 1.8 kb upstream, exon 1, intron 1, exon 2, intron 2, and partial exon 3. The transcription initiation site is indicated by an arrow and +1. More than 100 embryos (3 days postfertilization, dpf) were used to determine the GFP-reporter gene expression level for each construct. The expression of fluorescence is indicated by +, and no fluorescence observed by -. B: A representative example of transient expression of the pZVMHC-1834 construct. |
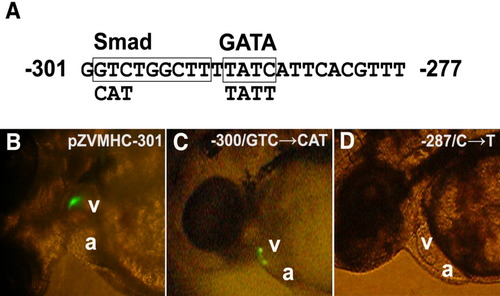
GATA-binding site is essential for ventricle-specific vmhc expression. A: The regulatory region (-301/-277) of vmhc contains two transcription factor-binding sites, Smad and GATA (boxes). B: Zebrafish (3 days postfertilization, dpf) injected with plasmid vmhc-301 showed transient expression of green fluorescent protein (GFP). C: When GTC at -300 of vmhc-301 (Smad-binding site) was replaced by CAT, the GFP reporter gene was still expressed in the ventricle with a slight reduction of intensity. D: A single nucleotide substitution of the GATA site (C→T at -287) completely abolished GFP expression. |

Antisense morpholino nucleotides (MOs) effectively affected development of heart as well as expression of vmhc promoter reporter gene (green fluorescent protein [GFP]). Living embryos are shown at 48 hours postfertilization (hpf). A-H: Representative transgenic embryos showing the effects of ventricle-specific GFP expression in vmhc:gfp compared with the control (A; Mock, injection buffer injected), GATA4 MO-injected (B; MO4), GATA5 MO-injected (C; MO5), GATA6 MO-injected (D; MO6), GATA4 and GATA5 MO-injected (E; MO4+5), GATA4 and GATA6 MO-injected (F; MO4+6), GATA5 and GATA6 MO-injected (G; MO5+6), GATA4, GATA5 and GATA6 MO-injected (H; MO4+5+6) embryos. At 48 hpf, the control embryos showed no significant difference in GFP expression compared with either the GATA4 or GATA6 morphants. GATA5 morphant displayed cardia bifida but the GFP intensity was not reduced (C). In contrast, simultaneous injection of GATA4 and GATA6 MOs resulted in embryos with significantly decreased ventricular GFP expression (F). Views are dorsal and anterior to the left. The percentages of embryo with each intensity are indicated in parentheses. |
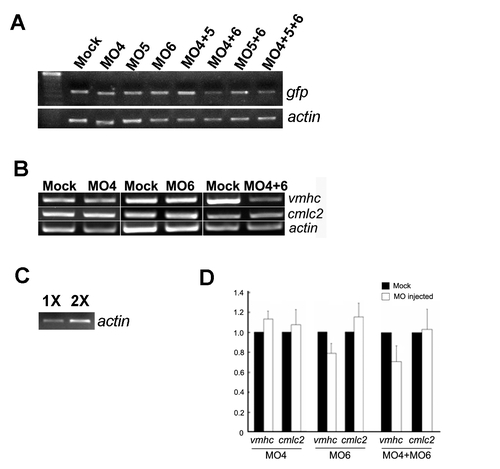
Quantitative analyses. Representative semiquantitative RT-PCR results for the gfp (A), heart-specific markers vmhc and cmlc2 (B) in MO-injected embryos at 48 hpf. The assay used 1 μg of total RNA for the RT reaction. Control experiment was performed with 1 μg (1X) and 2 μg (2X) of total RNA (C). We consistently found significant decrease in expression levels of vmhc and gfp when comparing Mock and GATA4 and -6 double-deficient embryos (MO4+6). (D) The expression level of endogenous vmhc and cmlc2 mRNA after 48 h of injection of antisense morpholino nucleotides (MOs) against GATA4 and GATA6. Intensities of bands from three independent semi-quantitative RT-PCR experiments were measured (P < 0.05) |

Unillustrated author statements EXPRESSION / LABELING:
|