
- Title
-
The mob as tumor suppressor (mats1) gene is required for growth control in developing zebrafish embryos
- Authors
- Yuan, Y., Lin, S., Zhu, Z., Zhang, W., and Lai, Z.C.
- Source
- Full text @ Int. J. Dev. Biol.
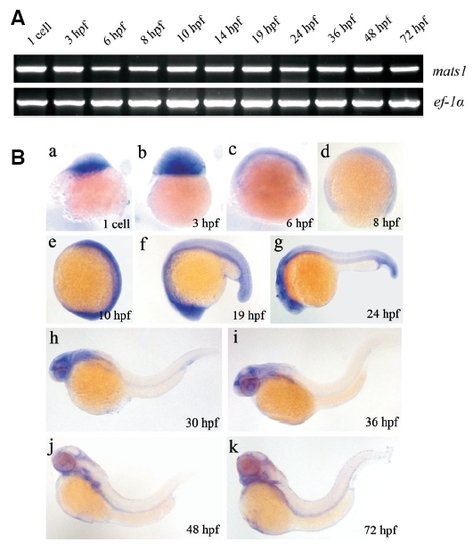
mats1 is expressed during zebrafish early development. (A) Temporal expression of mats1 detected by RT-PCR. ef-1a is shown on the bottom panel as an internal control. (B) Expression of mats1 during early development detected by in situ hybridization. The animal pole is towards the top in (a-d). Anterior is towards the top and dorsal is towards right in (e). Anterior is towards left and dorsal towards top in (f-k). They are all showed by lateral view. Before 24 hpf, expression of mats1 is ubiquitous. After 24hpf, mats1 expression was observed in the head region of the body. EXPRESSION / LABELING:
|
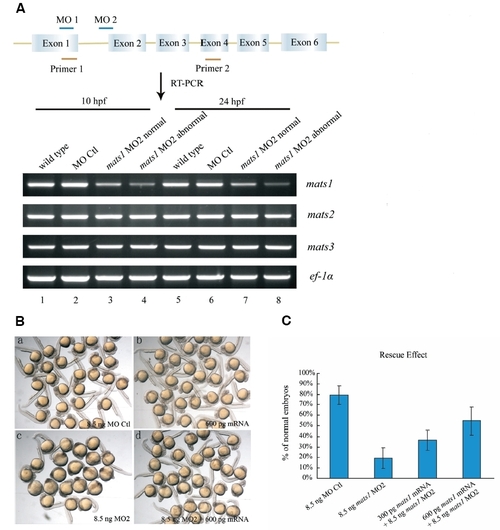
Expression of mats1 is reduced by morpholino treatment. (A) Location of mats1 MOs and effect of mats1 MO2 on mats1 mRNA levels. The schematic structure of mats1 gene is shown, and the size is not in scale. mats1 MO1 binds to ATG site and mats1 MO2 binds to the intron1-exon2 boundary. RT-PCR was done with primers 1 and 2 to detect mats1 mRNA levels at 10 hpf and 24 hpf. mats1 MO2 morphants showing abnormal phenotype and normal phenotype were grouped separately. Expression of mats1 was reduced in mats1 MO2 morphants (lane 3-4 and lane 7-8) compared to wild-type (lane 1 and 5) and MO Ctl morphant (lane 2 and 6) embryos. Degree of the reduction was positively associated with severity of abnormal phenotype. As controls, mRNA levels of mats2 and mats3 were not affected. ef-1α was used as an internal control. (B) Rescue of mats1 MO2-induced developmental delay phenotype by mats1 mRNA. (a) Embryos injected with 8.5 ng MO Ctl as a control. (b) Embryos injected with 600 pg mats1 mRNA exhibited normal phenotype. (c) Embryos injected with 8.5 ng mats1 MO2 showed severe developmental delay. (d) Most embryos co-injected with 600 pg mats1 mRNA and 8.5 ng mats1 MO2 showed normal or less severe abnormal phenotype. (C) Rescue of mats1 morphants by mats1 mRNA is dosage-dependent. At 24 hpf, only 19% (n=181) of the mats1 MO2 morphant embryos were normal. However, co-injection of 300 pg mats1 mRNA with mats1 MO2 made 37% (n=142) of the embryos to become normal. When 600 pg mats1 mRNA was coinjected, 55% (n=196) of the embryos showed a normal phenotype. Although many remaining embryos still exhibited a developmental delay phenotype, the severity was decreased. Embryos injected with 8.5 ng MO Ctl were used as a control (n=134). All the statistical data included dead embryos. All the living embryos injected with 8.5 ng MO Ctl were normal. Standard errors were shown by the error bars. |
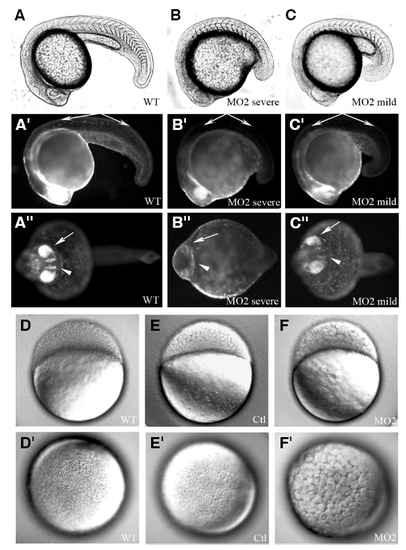
The mats1 gene is required for normal development of zebrafish embryos. (A-C″) 24 hpf embryos of a transgenic line 1040 whose CNS is marked by GFP. Bright-field images in (A-C). Fluorescent images of the same embryos shown in (A′ -C″). Lateral view in (A-C′). Ventral view in (A″-C″). “Severe” represents mats1 MO2 morphants which showed severe developmental delay, while “mild” represents those showed a weaker developmental delay phenotype. At 24 hpf, some neurons in trunk (indicate by long arrow) had already emerged in wild-type embryos, but they were not observed in mats1 MO2 morphants. Eyes (indicated by short arrow) were either not visible (B″) or less developed (C″) in mats1 MO2 morphants. Similarly, the brain (indicate by arrow head) was less developed in mats1 MO2 morphants (B″,C″). (D-F′) Embryos at 3.5 hpf. mats1 MO2 morphants show developmental delay at very early stage. Lateral view with anterior towards left in (D-F). Top view to see animal pole in (D′-F′). mats1 MO2 morphant embryos had fewer but bigger cells (F,F′) compared to wild-type embryos (D,D′) and embryos injected with MO Ctl (E,E′), suggesting that mats1 MO2 morphant cells divided less than control cells during the same period of time. |
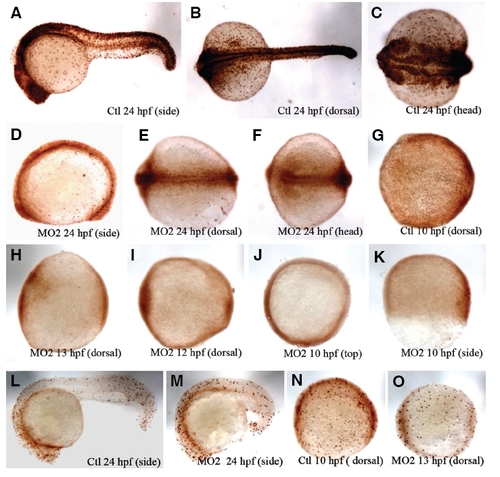
Cell proliferation was decreased in mats1 morphant embryos. (A-K) BrdU staining results at 24 hpf and tail bud stage. At the 24 hpf stage, BrdU levels were reduced in mats1 morphant embryos (D-F) compared to control wild-type embryos (A-C). While epiboly in wild-type embryos is finished at 10 hpf (G), this process is not completed in mats1 MO2 morphant embryos with the same age (J, K). Two to three more hours were needed for mats1 MO2 morphant embryos to reach tail bud stage (equivalent to 10 hpf of wild-type embryos at 28.5°C) (H, I). (L-O) PH3 antibody staining results. PH3 antibody staining results at tail bud stage and 24 hpf were consistent with BrdU staining, although the decreased degree of marked cell is not as distinctive as BrdU staining results. Anterior is towards left in all panels except for (J,K). Top view to see animal pole in (J), animal pole is towards top in (K). PHENOTYPE:
|
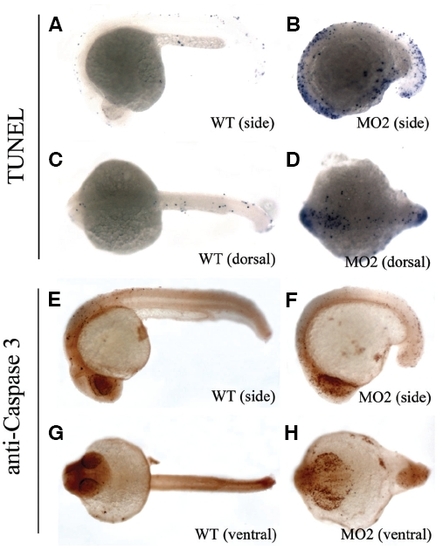
Apoptosis was increased in mats1 morphant embryos. (A-D) TUNEL staining results at 24 hpf derived from wild type embryos (A,C) and MO2-treated embryos (B,D). (E-H) Cleaved Caspase 3 antibody staining results at the same developmental stage with wild type embryos (E,G) and MO2 treated embryos (F,H). Anterior is towards left in all panels. Both of TUNEL and cleaved Caspase 3 antibody-staining results showed that apoptosis increased in mats1 morphant embryos. PHENOTYPE:
|
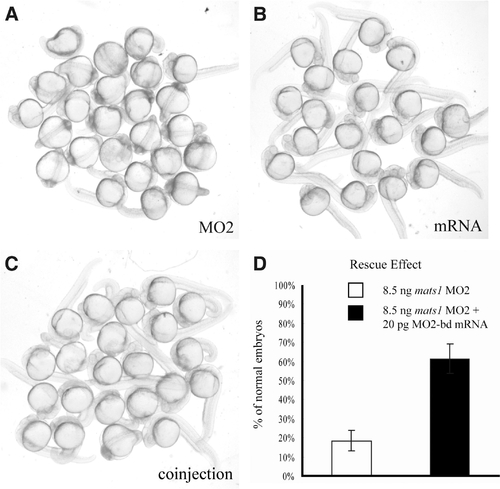
Rescue of mats1 MO2-induced developmental delay phenotype by MO2-bd mats1 mRNA. (A) Embryos injected with 8.5 ng mats1 MO2. (B) Embryos injected with 20 pg MO2-bd mRNA exhibited normal phenotype. (C) Most embryos co-injected with 20 pg MO2-bd mRNA and 8.5 ng mats1 MO2 showed normal or less severe abnormal phenotype. (D) Statistical analysis of rescue results. At 24 hpf, only 18% (n=182) of the mats1 MO2 morphant embryos were normal. However, co-injection of 20 pg MO2- bd mRNA with mats1 MO2 made 61% (n=150) of the embryos to become normal (T-test, p < 0.05). |
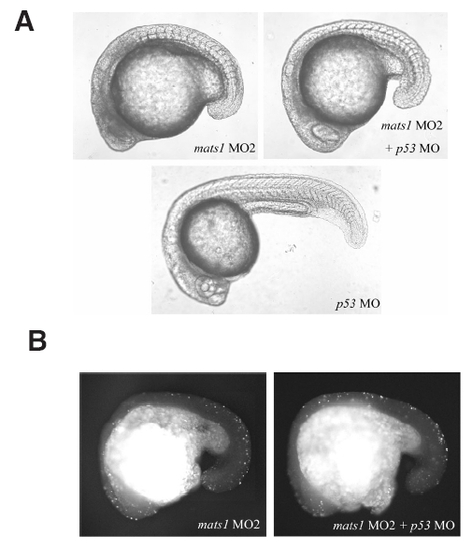
Phenotypes of mats1 morphants were not caused by off-target p53 activation. (A) The mats1/p53 morphant embryos still exhibited the developmental delay phenotype. Embryos injected with 17 ng p53 MO didn’t show any abnormal phenotype. When coinjected with 17 ng p53 MO plus 8.5 ng mats1 MO2, the severe developmental delay phenotype still exist, but the small, dark, necrotic heads phenotype was lessened. (B) The mats1/p53 double knockdown embryos still exhibited excessive apoptosis as demonstrated by TUNEL staining, with decreased signal in head region. Anterior is towards left and dorsal towards top in all panels. PHENOTYPE:
|