
- Title
-
Loss of myotubularin function results in T-tubule disorganization in zebrafish and human myotubular myopathy
- Authors
- Dowling, J.J., Vreede, A.P., Low, S.E., Gibbs, E.M., Kuwada, J.Y., Bonnemann, C.G., and Feldman, E.L.
- Source
- Full text @ PLoS Genet.
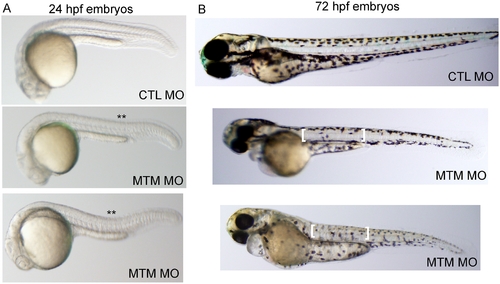
Abnormal morphology in myotubularin morphant embryos. (A) Live embryos at 24 hpf injected with either control (CTL) or myotubularin (MTM) morpholinos. MTM morphants are of equivalent size, but are bent or U-shaped in appearance. (B) Live embryos at 72 hpf injected with control (CTL MO) or myotubularin (MTM MO) morpholinos. MTM morphants are mildly dysmorphic in appearance, and display selective thinning of the muscle compartment (brackets) as well as foreshortening of their tails. PHENOTYPE:
|
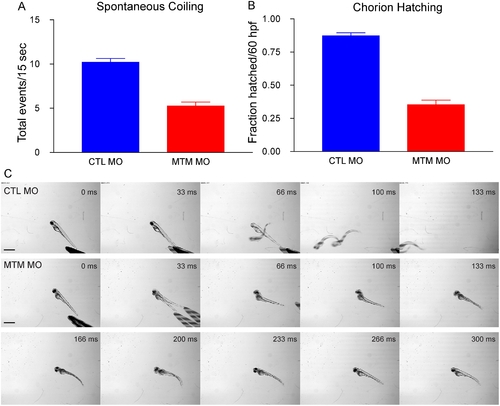
Abnormal motor function in myotubularin morphants. (A) Quantitation of spontaneous embryo coiling at 24 hpf (see also Supplemental Videos 1 and 2). On average, CTL morphants coiled 10.2 times in 15 seconds, while MTM morphants coiled only 5.2 times. (B) Quantitation of chorion hatching in 60 hpf morphants. 87.2% of CTL morphants are hatched from their protective chorions by 60 hpf, as opposed to only 35.3% of MTM morphants. (C) Touch-evoked swimming was video captured in 72 hpf morphants. As expected, CTL morphants responded to tactile stimuli with a rapid escape response contraction followed by swimming. Conversely, MTM morphants displayed a weak escape contraction followed by “twittering” movements (example at 33 ms) but never normal swimming. Scale bar = 1 mm. PHENOTYPE:
|
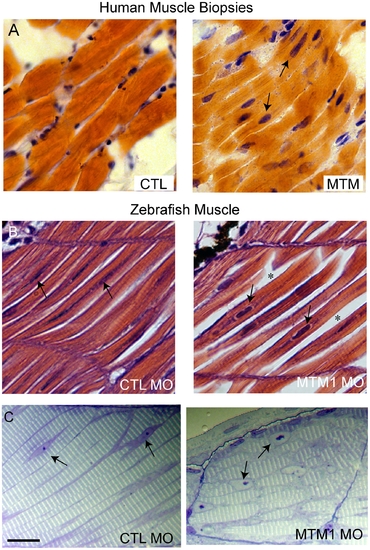
Abnormal histopathology in 72 hpf myotubularin morphants. (A) H/E stained longitudinal myofibers from myotubular myopathy (MTM) and age matched control (CTL) human muscle biopsies. Arrows point to abnormal nuclei. (B) H/E stained longitudinal myofibers from control (CTL MO) and myotubularin (MTM MO) morphant 72 hpf embryos. Myonuclei are abnormally rounded (arrows), and there is increased space between fibers (*). (C) Toluidine blue stained semi-thin sections from 72 hpf morphants. Myonuclei from myotubularin morphants are large, abnormally rounded, and contain discrete nucleoli (arrows). Sarcomeric units, however, are normal in appearance. Scale bar = 20 mm. PHENOTYPE:
|
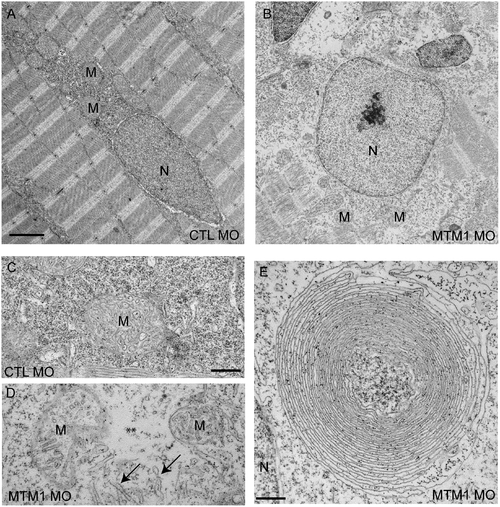
Abnormal perinuclear ultrastructure in 72 hpf myotubularin morphants. Comparison of the perinuclear area from control (CTL MO) and myotubularin (MTM MO) morphants. (A, B) Control injected embryos had thin myonuclei (N) with well organized perinuclear organelles (M = mitochondria). Myotubularin injected embryos had large, rounded nuclei (N) and disorganized perinuclear compartments. Three embryos from three independent injections were examined. Higher magnification (C, D) of the perinuclear compartment revealed abnormal mitochondria (M), areas nearly devoid of organelles (**), and several tubule-like structures (arrows). (E) Example of an unusual membranous perinuclear structure. Such structures were observed in multiple myofibers. Scale bars: A, B (2 mm), C–E (500 nm). PHENOTYPE:
|
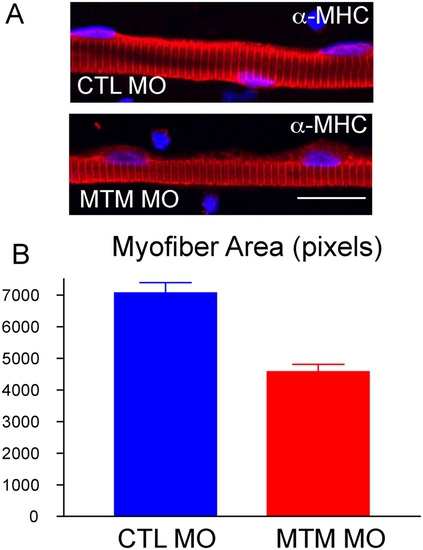
Myofiber hypotrophy in myotubularin morphants. (A) Representative myofibers from control (CTL) and myotubularin (MTM) morphant embryos at 72 hpf. Fibers were immunostained with an antibody to myosin heavy chain (a-MHC). MTM fibers have normal MHC staining, but appear thinner. Scale bar = 20 mm. (B) Quantitation of myofiber size. Control myofibers averaged 7000 pixels, while myotubularin morphant fibers were only 4000 pixels. PHENOTYPE:
|
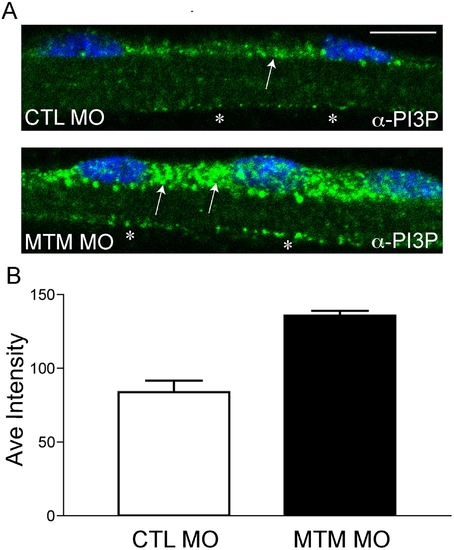
Increased PI3P levels in myotubularin morphant myofibers. (A) Representative myofibers immunostained with anti-PI3P. Perinuclear staining of PI3P in myotubularin morphant myofibers is much more abundant than in control myofibers (arrows). There is also a modest increase in membrane localized PI3P (*). Scale bar = 10 mm. (B) Quantitation of PI3P immunofluorescence. PI3P intensity measured over a uniform perinuclear area (see methods for details) and was 83.7+/-7.8 pixels for control morphants and 135.5+/-3.3 for myotubularin morphants (3 trials; p = 0.0027). This represented a 1.6x increase in PI3P staining intensity. PHENOTYPE:
|
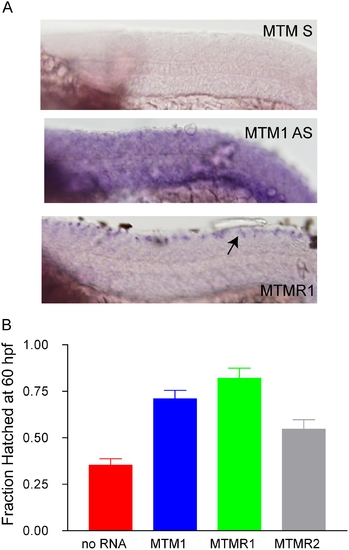
MTMR rescue of the myotubularin morphant phenotype. (A) Whole mount in situ hybridization of 24 hpf embryos reveals muscle staining for myotubularin (MTM1 AS) and not for MTMR1 or MTMR2 (data not shown). A sense probe to MTM1 (MTM1 S) was used as a background control. (B) RNA rescue experiment. RNA to MTM1, MTMR1 or MTMR2 was co-injected with myotubularin morpholino. Rescue was determined by the % of hatched embryos at 60 hpf. Values were: No RNA (35.5%+/-3.3%, N = 201), MTM1 RNA (71%+/-4.5, N = 100, p (when compared to No RNA)<0.0001), MTMR1 RNA (82%+/-5.5%, N = 50, p<0.001), MTMR2 RNA (54.6%+/-5.1% N = 97, p = 00015). |
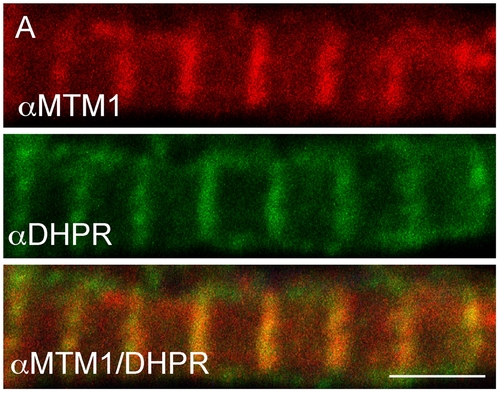
Myotubularin localizes to T-tubules. Myotubularin and DHPRa1 co-localize. Double label immunofluorescence was performed on isolated myofibers. As demonstrated using confocal microscopy, myotubularin (red) and DHPRa1 (green) signal significantly overlap (orange, panel 3). Scale bar = 10 mm. EXPRESSION / LABELING:
|
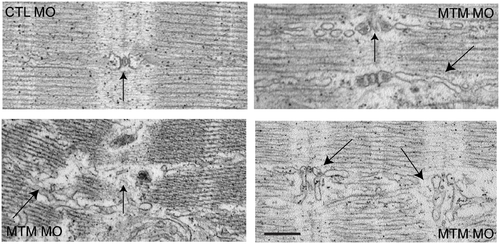
T-tubule structural abnormalities in myotubularin morphant muscle. T-tubule (vertical arrows) and sarcoplasmic reticulum (angled arrows) abnormalities as demonstrated by electron microscopy. Control morphant (panel 1; CTL): normal T-tubule triad with accompanying thin, well-organized SR network (arrow). Myotubularin morphants (panels 2–4): Panel 2 shows mildly dilated triads and SR networks. Panel 3 shows severely dilated and dysmorphic triads and widely looped SR. Panel 4 illustrates severe disorganization, with unrecognizable T-tubule triads and aberrant adjacent SR networks. Scale bar = 500 nm. PHENOTYPE:
|
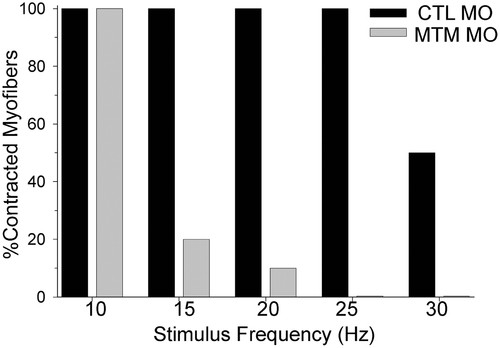
Excitation-Contraction Coupling abnormalities in myotubularin morphants. Excitation-contraction (E–C) coupling. Control morphant myofibers could respond to 15 ms depolarizing current injections to 0 mV from 0 to 30 Hz (average max frequency = 27.0+/-0.9 Hz, N = 5). In contrast, myotubularin morphant muscle progressively failed to contract to stimuli above 10 Hz (average maximum frequency = 11.5+/-1.5 Hz, N = 5, p<0.0001). PHENOTYPE:
|
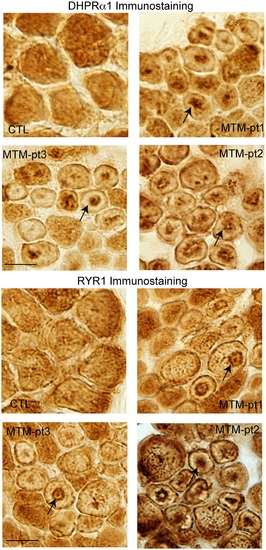
Alteration of T-tubule/SR component localization in myotubular myopathy. Muscle from 3 myotubular myopathy patients and an age matched control were immunostained with DHPRa1 to mark T-tubules (A) and RYR1 to mark the adjacent sarcoplasmic reticulum (B). Abnormal distribution of DHPRa1 and RYR1 was observed in numerous fibers in all 3 myotubularin patients but in none of the control fibers (arrows). Scale bar = 20 mm. |
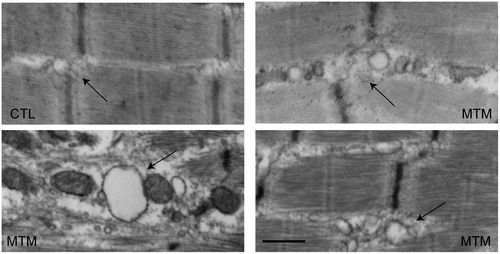
Ultrastructural changes in T-tubules in myotubular myopathy. Electron microscopic analysis of muscle from 3 myotubular myopathy patients (MTM) and one age-matched control (CTL). Control T-tubule triads are discretely formed (arrow), and the adjacent SR network is thin and well organized. Triads and adjacent SR from patient biopsies are dilated and disorganized. Scale bar = 500 nm. |

RNA expression of zebrafish MTMRs. RNA was isolated from 24 hpf zebrafish embryos and processed for RT-PCR. PCR was performed with primers specific for MTM1 and MTMRs 1–15 (excluding MTMRs 4 and 11). Bands were detected for all MTMRs tested. |
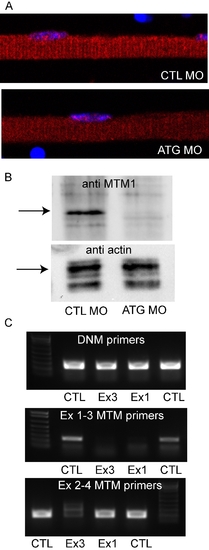
Morpholino knockdown of zebrafish myotubularin. (A) Immunohistochemistry using a myotubularin antibody on isolated myofibers from embryos injected with control (CTL MO) or myotubularin ATG (ATG MO) morpholinos. The linear staining pattern observed in control myofibers (see Figure 8) was barely detectable in MTM1 morphant fibers. (B) Western blot analysis from protein isolated from 72 hpf embryos injected with control (CTL MO) or myotubularin ATG (ATG MO) morpholinos. A band corresponding to myotubularin was detected in CTLs but not in MTM morphants. Blots were re-probed with actin to assure equal loading. (C) RT-PCR analysis from RNA extracted from 48 hpf control (CTL), exon 3 specific (Ex3), and exon 1 specific (Ex1) myotubularin morphants. Top panel: dynamin-2 (DNM) specific primers reveal intact RNA and equal starting cDNA from all samples. Middle panel: primers spanning exons 1–3 reveal reduced products for both the exon 1 and exon 3 splice blocking morphants. Bottom panel: primers spanning exons 2–4 reveal substantially reduced product in the exon 3 splice blocking morphants but a normal product in the exon 1 morphants. Taken together, the RT-PCR data reveals that the Ex1 morpholino successfully results in exclusion of exon 1 from the final RNA. The Ex3 morpholino causes exclusion of exon 3 as well as overall reduction in MTM1 RNA, likely due to nonsense mediated decay mechanisms. |
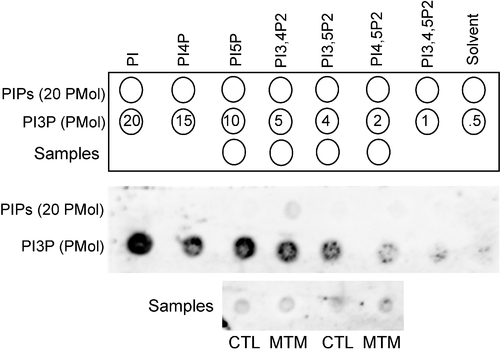
Total PI3P levels are unaffected in myotubularin morphants. PI3P mass strip assay performed on lipids isolated from control (CTL MO) or myotubularin (MTM MO) 72 hpf morphant embryos. No difference in PI3P levels was observed in MTM1 morphants (CTL 0.87 Pmol+/-0.10; MTM 0.83 Pmol+/-0.07; n = 3). Equal spotting of lipids was determined by measuring PI4P levels on duplicate samples (data not shown). |
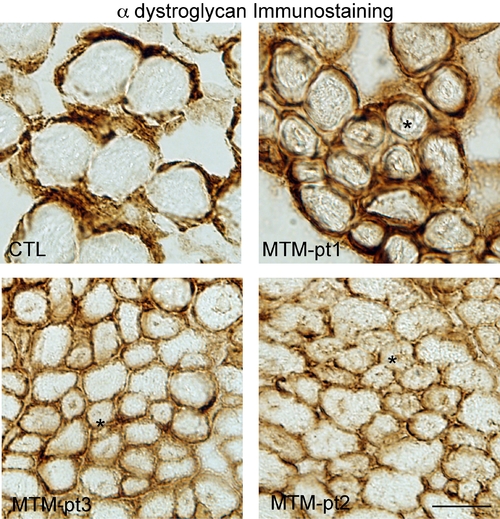
α dystroglycan staining on human biopsy samples. Immunohistochemistry with an α dystroglycan antibody. Note the normal staining around the plasma membrane and the lack of internal staining. * indicate examples of fibers with central nuclei. Scale bar = 20 mm. |

Unillustrated author statements PHENOTYPE:
|