
- Title
-
FGF-dependent left-right asymmetry patterning in zebrafish is mediated by Ier2 and Fibp1
- Authors
- Hong, S.K., and Dawid, I.B.
- Source
- Full text @ Proc. Natl. Acad. Sci. USA
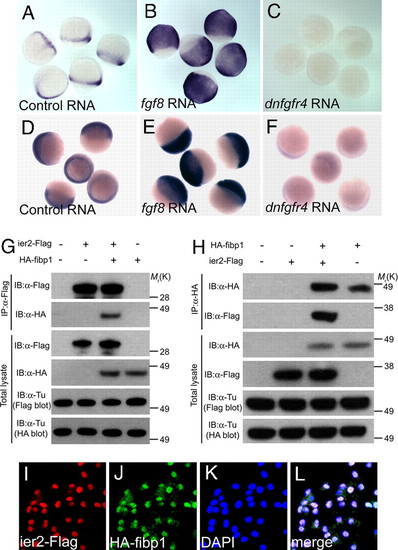
Ier2 and Fibp1 are Downstream of FGF. (A–F) Whole-mount in situ hybridization with ier2 (A–C) at 80% epiboly, and with fibp1 (D–F) at 60% epiboly stages after injection of control gfp RNA, 100 pg (A and D); fgf8 RNA, 5 pg (B and E); and dnfgfr4 RNA, 300 pg (C and F). (G and H) Physical interaction between Ier2 and Fibp1. Immunoprecipitation (IP) and immunoblotting (IB) are indicated. (I–L) Intracellular localization of Ier2 and Fibp1. Ier2 (I) and Fibp1 (J) are colocalized in the nucleus (K) after injection of epitope-tagged constructs into zebrafish embryos. (L) Merged image I–K |
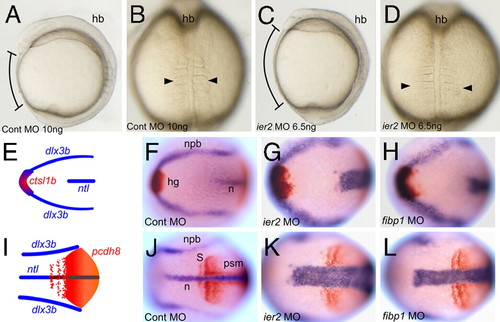
Ier2 and Fibp1 are required for convergent extension. Control (A and B) and ier2 morphant (C and D). Lateral (A and C) and dorsal (B and D) views at the 5-somite stage. Brackets in A and C show the distance between head and tail, and arrowheads in B and D show the width of the somites. (E–L) Two-color in situ hybridization with marker genes at the 3-somite stage. Dorsal views of anterior (E–H) and posterior (I–L) region. (E and I) Drawings of a normal embryo indicating the patterns of the markers used, ctsl1b (red), dlx3b (blue), ntl (blue), and pcdh8 (red). (F and J) Control MO-injected embryo. (G and K) ier2 MO-injected embryo. (H and L) fibp1 MO-injected embryo. In the experimental embryos, notochord and somites are wider and extension along the A/P axis is reduced. PHENOTYPE:
|
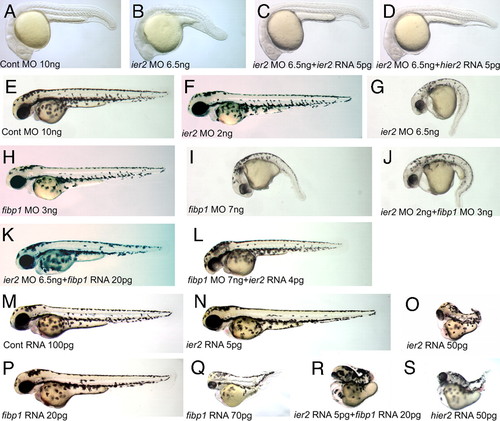
Functional interaction between Ier2 and Fibp1. (A–D) Lateral views at 24 hpf. The ier2 MO-injected embryo has a short trunk (B) compared with the control (A). The ier2 MO phenotype was rescued by coinjection with zebrafish ier2 mRNA (C) and human ier2 mRNA (D). (E–S). Lateral views at 48 hpf. (E–L) Knock down phenotypes. Low doses of ier2 MO (F) or fibp1 MO (H) have no phenotype, whereas effective doses of ier2 MO (G) and fibp1 MO (I) show very similar phenotypes. Coinjection with both MOs at low dose mimics the high-dose phenotype (J). ier2 MO is rescued by fibp1 RNA (K), and fibp1 MO is rescued by ier2 RNA (L). (M–S) Ier2 and fibp1 overexpression phenotypes. (M) Control RNA-injected embryos. (N and O) ier2 RNA injection phenotypes at low dose and effective dose. (P and Q) fibp1 RNA injection phenotypes at low dose and effective dose. (R) Coinjection of low dose of ier2 plus fibp1 RNA. (S) Injection of human hier2 RNA. |
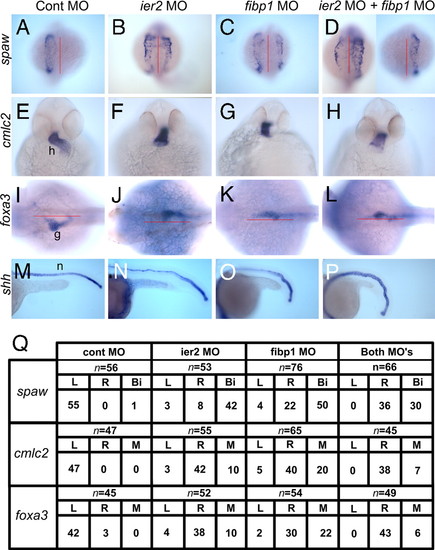
Ier2 and Fibp1 are required to establish left–right asymmetry in zebrafish. Control MO (A, E, I, and M), ier2 MO, 6.5 ng (B, F, J, and N), fibp1 MO, 7 ng (C, G, K, and O), and ier2 MO plus fibp1 MO, 2 plus 3 ng (D, H, L, and P) were injected, and embryos examined by whole-mount in situ hybridization. (Q) Quantification of experiments illustrated in A-L. (A–D) Dorsal view of spaw expression at 19 hpf. MO-injected embryos show bilateral expression (B–D) compared with left side expression of controls (A). (E–H) Ventral view of cmlc2 expression at 36 hpf. Ier2 and fibp1 MO cause abnormal heart laterality and looping (F–H); control in E. (I–L) Asymmetric expression of foxa3 in gut was altered by ier2 or fibp1 MO injection (J–L), compared with controls (I), all at 36 hpf. (M–P) Ier2 and fibp1 MOs caused notochord undulation at 22 hpf. h, heart; g, gut; n, notochord. PHENOTYPE:
|
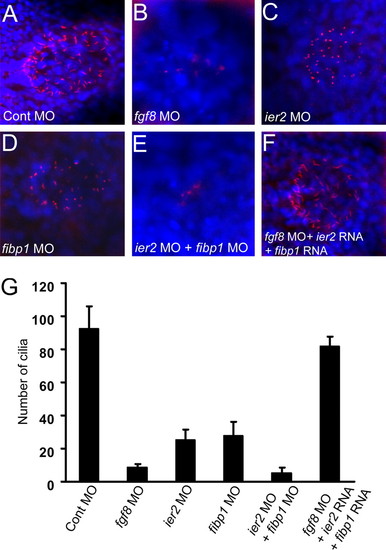
Cilia formation in Kupffer′s vesicle depends on Ier2 and Fibp1. (A–F) Monocilia were detected with anti-acetylated tubulin antibody (red), and nuclei with DAPI (blue) in Kupffer′s vesicle at the 5-somite stage. fgf8 MO, 8 ng (B) and ier2 MO plus fibp1 MO (E) -injected embryos show dramatic reduction of cilia, compared with control (A). Moderate reduction of cilia by ier2 MO (C) or fibp1 MO (D) alone was observed. Loss of cilia was rescued by coinjection with ier2 RNA plus fibp1 RNA with fgf8 MO (F). For levels of MOs see legend to Fig. 4. (G) Number of cilia in Kupffer′s vesicle; 12 embryos were counted in each case corresponding to images in (A–F). n, notochord. PHENOTYPE:
|
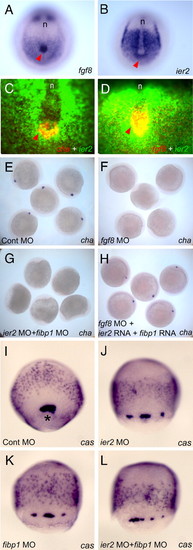
Involvement of Ier2 and Fibp1 in forerunner cell formation and in charon expression in Kupffer′s vesicle. (A–H), embryos were fixed at the 5-somite stage. Expression patterns of fgf8 (A and D), ier2 (B–D), and cha (C) in normal embryos. Red arrowheads indicate Kupffer′s vesicle. (A and B) In situ hybridization with purple staining. (C and D) Fluorescence in situ hybridization. (E–H) Charon expression depends on FGF signaling and Ier2/Fibp1 function. Embryos were hybridized with cha probe after injection of control MO (E), fgf8 MO (F), ier2 MO plus fibp1 MO (G), and fgf8 MO + ier2 RNA + fibp1 RNA (H). (I–L) Embryos at 80% epiboly hybridized with casanova (cas) probe, which highlights dorsal forerunner cells labels endoderm. An asterisk points to dorsal forerunner cells. The embryos were injected with the MO indicated. For levels of MOs see legends to Fig. 4 and 5. n, notochord. EXPRESSION / LABELING:
PHENOTYPE:
|
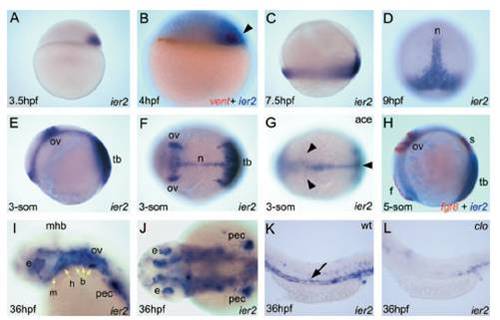
Expression Pattern of ier2. (A) Lateral view of ier2 expression at 3.5hpf. ier2 expression can be detected only after the midblastula transition (MBT). (B) Lateral view of 2-color in situ hybridization of ier2 (blue) and the ventral marker vent (red) at 4hpf. Arrowhead points to ier2 expression at the dorsal side. (C) Lateral view of ier2 expression at 7.5hpf in the marginal region. (D) Dorsal view of notochord and marginal region expression of ier2 at 9hpf. (E–G) Lateral (E) and dorsal views (F and G) of ier2 expression pattern of wt (E and F) and ace (G) embryos at the 3-somite stage. Arrowheads in G indicate loss of ier2 expression in ace mutant. (H) Lateral view of 2-color in situ hybridization of ier2 (blue) and fgf8 (red) at the 5-somite stage. (I–L) Lateral (I, K, and L) and dorsal view (J) of ier2 expression in the head (I and J) and trunk (K and L) region at 36hpf. Yellow arrows in I indicate pharyngeal expression of ier2. Arrow in K points to blood vessel. b, brachial arch; e, eye; f, forebrain; h, hyoid arch; m, mandibular arch; n, notochord; ov, otic vesicle; pec, pectoral fin; tb, tail bud. |
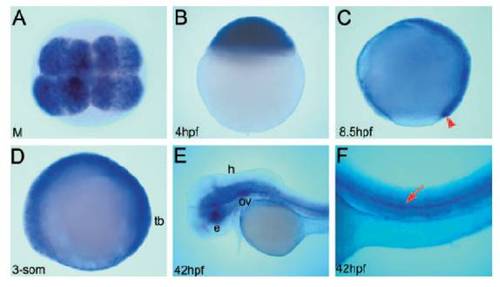
fibp1 Expression Pattern. (A) Dorsal view of maternal expression of fibp1 at the 8-cell stage. (B) Lateral view of fibp1 expression at 4hpf. (C) Lateral view of fibp1 expression at 8.5hpf. A red arrowhead points to fibp1 expression in the fore-runner cells that are precursors of Kupffer’s vesicle. (D–F) Ubiquitous expression of fibp1 at 3-somite and 42hpf stages (E and F). Arrow in F points to the notochord. |
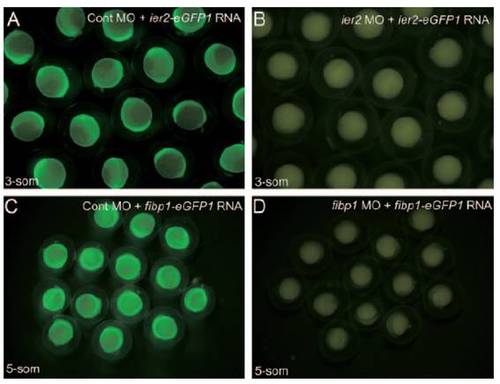
Efficiency of ier2 and fibp1 MOs. (A and B) ier2 MO plus ier2-egfp1 RNA-injected embryos completely lost the GFP signal (b) compared with control MO-injected embryos (a), as seen at the 3-somite stage. (C and D) fibp1 MO likewise inhibited the GFP signal d, as seen at the 5-somite stage. |
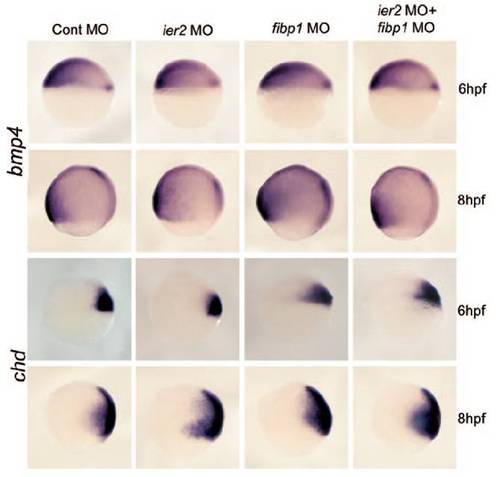
Dorsal-ventral axis specification in MO injected embryos. Embryos were injected with the MO shown at the top of each column, fixed at the times shown on the right, and hybridized with bmp4 (ventral marker) or chordin (dorsal marker) as indicated on the left. The injection of these MOs had no substantial effect on the dorsal-ventral patterning of these embryos. |
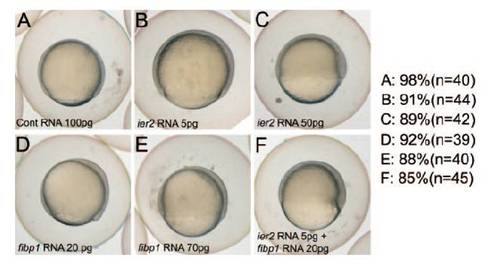
Synergism between ier2 and fibp1 RNA injection. Embryos were injected as indicated in the figure and photographed at the same time when control embryos were at 80% epiboly. A dosage dependent delay in epiboly is seen after RNA injection, with a synergistic effect of injection of both RNA. To the right are shown percentages of embryos for each condition that look like the embryo illustrated–thus the numbers represent normal embryos in A, B, and D and delayed embryos in C, E, and F. |