
- Title
-
Muscle degeneration and leukocyte infiltration caused by mutation of zebrafish fad24
- Authors
- Walters, K.B., Dodd, M.E., Mathias, J.R., Gallagher, A.J., Bennin, D.A., Rhodes, J., Kanki, J.P., Look, A.T., Grinblat, Y., and Huttenlocher, A.
- Source
- Full text @ Dev. Dyn.
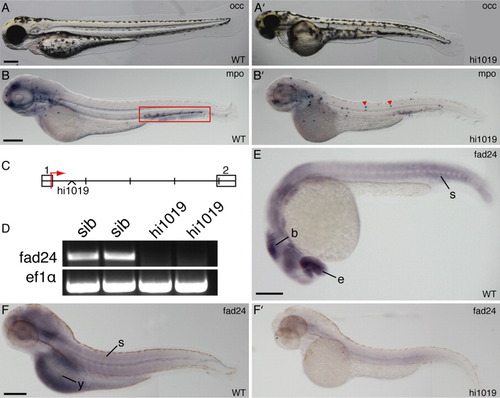
Fad24hi1019 mutants exhibit a chronic inflammatory phenotype and reduced expression of fad24. A,A′: Oblique coherent contrast (OCC) images of WT and homozygous fad24hi1019 larvae at 3 dpf. B,B′: Zebrafish mpo in situ hybridizations of WT and fad24hi1019 larvae at 3 dpf. Box, CHT; arrows, neutrophils in the body of fad24hi1019 mutants. C: Genomic map of the first two exons of zebrafish fad24 showing the location of the hi1019 insertion; each section = 500 bp. D: RT-PCR analysis of WT (lanes 1,2) and fad24hi1019 mutant (lanes 3,4) single larvae at 3 dpf; ef1α is used as a control. E, F, F′: In situ hybridization of zebrafish fad24 in WT (E,F) and fad24hi1019 mutants (F′) at 26 hpf (E) and 3 dpf (F,F′). b, brain; e, eye; s, somite; y, yolk. Lateral view, anterior to the left. Scale bars = 200 μm. Representative results from at least three experiments with greater than 10 larvae per condition per experiment. EXPRESSION / LABELING:
PHENOTYPE:
|
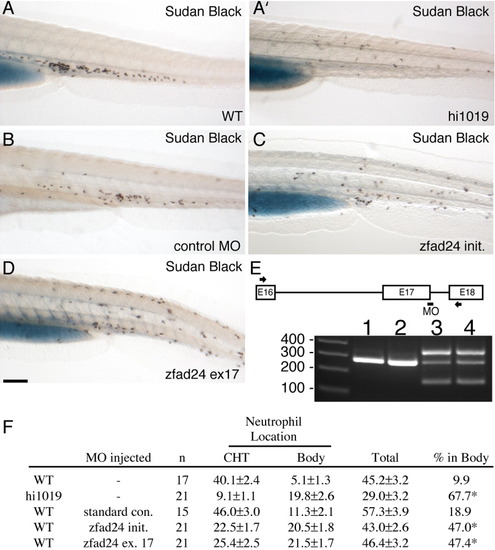
Injection of fad24 MO into WT embryos phenocopies the fad24hi1019 leukocyte infiltration phenotype. Shown is the CHT and surrounding tissues of sudan black stained WT (A) and fad24hi1019 (A′) larvae or control MO- (B), zfad24 init. MO- (C), or zfad24 ex17 MO- (D) injected larvae. Lateral view, anterior to the left at 3 dpf. Scale bar = 200 μm. E: Schematic of fad24 exon 16, 17, and 18 with the target site of the zfad24 ex17 MO labeled. Arrows, locations of primers used for RT-PCR of total RNA isolated from single embryos at 24 hr post-injection of either uninjected (lane 1), standard control (lane 2), or zfad24 ex17 (lanes 3 and 4) MO. F: Quantification of neutrophil location (either in the CHT or in the body) seen in WT and fad24hi1019 larvae or control MO-, zfad24 init. MO-, or ex17 MO-injected larvae analyzed by one-way ANOVA at a 95% confidence level using Dunnett's multiple comparison post-test. *P < 0.05. Results reported as average ± SEM. PHENOTYPE:
|
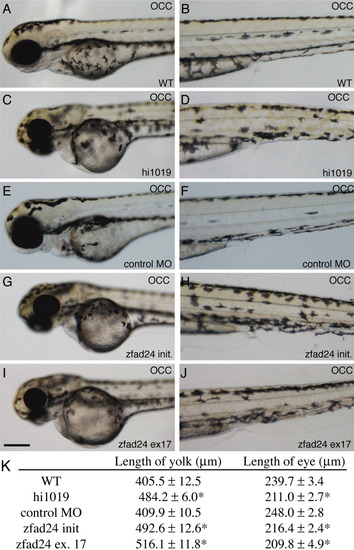
Injection of fad24 MOs into WT embryos phenocopies the fad24hi1019 morphological phenotypes. OCC images of the head and yolk (A,C,E,G,I) or body (B,D,F,H,J) of WT (A,B) and fad24hi1019 (C,D) larvae or control MO- (E,F), zfad24 init. MO- (G,H), or zfad24 ex17 MO- (I,J) injected larvae. K: Comparison of yolk sac and retina length for WT and fad24hi1019 larvae or control MO-, zfad24 init. MO-, or zfad24 ex17 MO-injected larvae. Results reported as average ± SEM, analyzed by one-way ANOVA at a 95% confidence level using Dunnett's multiple comparison post test. *P < 0.05. Representative results from three experiments. PHENOTYPE:
|
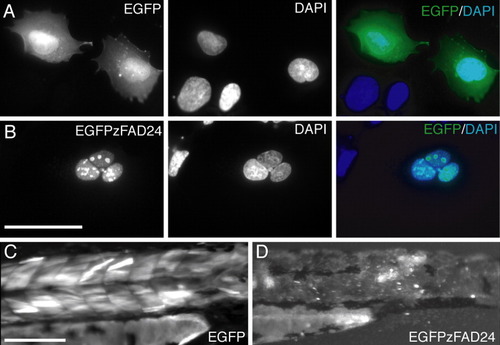
Zebrafish Fad24 localizes to nuclear granules. HEK cells transfected with EGFP (A) or N-terminal EGFP-tagged zebrafish Fad24 (B). DAPI staining is used to reveal the nucleus. Scale bar = 50 μm. Transient expression of EGFP (C) or N-terminal EGFP tagged zebrafish Fad24 (D) in muscle cells of 3-dpf WT larvae. Scale bar = 200 μm. Representative results from three experiments. |
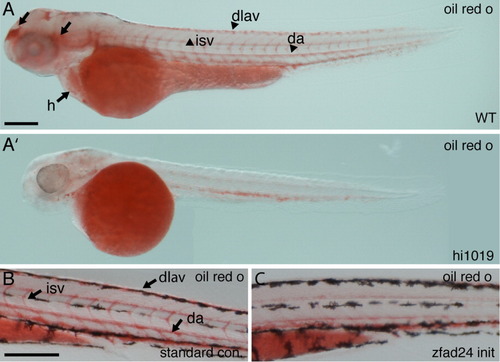
Fad24hi1019 mutants exhibit defects in lipid metabolism. A, A′: Oil red O staining in a PTU-treated WT (A) and fad24hi1019 (A′) larvae. Arrows, areas of staining in the head and heart; arrowheads, areas of staining in the vasculature that are absent in the fad24hi1019 mutant. B, C: Oil red O staining in the body of control (B) or zfad24 init. MO- (C) injected larvae. h, heart; isv, intersegmental vessel; da, dorsal aorta; dlav, dorsal longitudinal anastomotic vessel. Lateral view, anterior to the left at 3 dpf. Scale bar = 200 μm. Representative results from three experiments with greater than 10 larvae per condition per experiment. PHENOTYPE:
|
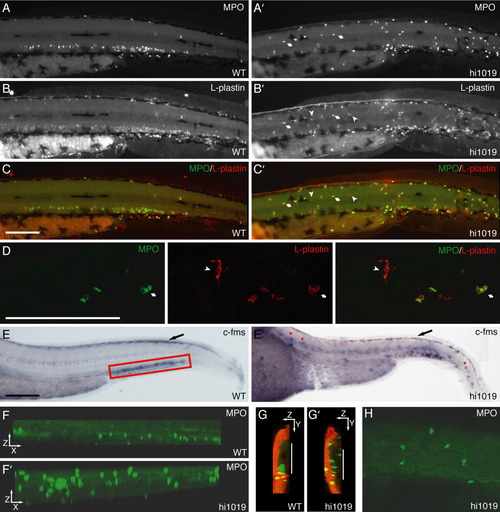
Leukocyte recruitment into the body of fad24hi1019 mutants. A-C: WT larvae. A′-C′: fad24hi1019 mutant larvae. Immunolabeling for MPO (A,A′) and L-plastin (B,B′). C,C′: Overlay of MPO and L-plastin co-immunolabeling shows that neutrophils, MPO+ and L-plastin+ (arrows), and macrophages, L-plastin+ and MPO- cells (arrowhead), contribute to the inflammatory response. D: Confocal projections show the more elongated morphology of macrophages (arrowhead) compared to neutrophils (arrow). E,E′: Whole-mount in situ hybridization for c-fms, a macrophage marker. Red box, CHT; red arrows, macrophages in the body of fad24hi1019 mutants. Black arrows point to c-fms expression in the neural crest. F,F′: XZ projections of MPO-labeled WT and fad24hi1019 larvae. G,G′: ZY projections of MPO (green) and p63 (red, to mark the epidermis) double-immunolabeled larvae. White line, the midline of the larva. H: A 3.9-μm optical longitudinal section through the muscle of a fad24hi1019 larvae immunolabeled for MPO. All images except F,F′G,G′ are in lateral view, anterior to the left, and all images are at 3 dpf. Scale bar = 200 μm. Representative results from three experiments. EXPRESSION / LABELING:
PHENOTYPE:
|
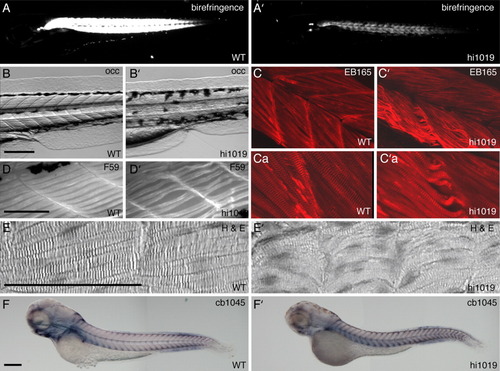
Fad24hi1019 mutants exhibit muscle degeneration. A-F: WT larvae. A′-F′: fad24hi1019 mutant larvae. A,A′: Polarized light microscopy to reveal birefringence of muscle. B,B′: OCC images of trunk muscle. C,C′: Confocal projections of trunk muscle immunolabeled with the fast-muscle myosin specific antibody EB165. Ca,C′a: Zoomed in images better showing muscle fiber striation and size. D,D′: Immunolabeling with the slow-muscle myosin specific antibody F59. E,E′: Hematoxylin and Eosin-stained longitudinal sections through trunk muscle tissue. F,F′: In situ hybridization using probe cb1045 to reveal myoseptum separating the somites of developing larvae. Lateral view, anterior to the left at 3 dpf. Scale bar = 200 μm. Representative results from three experiments with greater than 10 larvae per condition per experiment. EXPRESSION / LABELING:
PHENOTYPE:
|
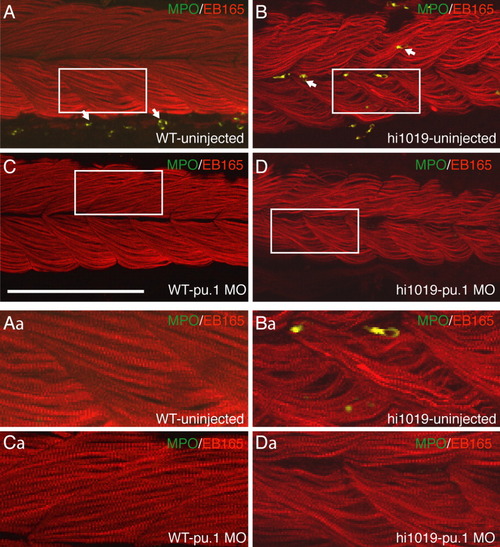
Onset of muscle degeneration in fad24hi1019 mutants is not mediated by leukocytes. Tailfin views at 3 dpf. A,C: WT. B,D: fad24hi1019 mutants. A-D: Co-immunolabeling for zMPO (green) and fast-muscle myosin (red) in uninjected (A,B) and pu.1 MO-injected (C,D) larvae. Arrows, neutrophils; white boxes, areas magnified in Aa,Ba,Ca,Da. Lateral view with anterior to the left. Scale bar = 200 μm. Representative results from three experiments. EXPRESSION / LABELING:
PHENOTYPE:
|
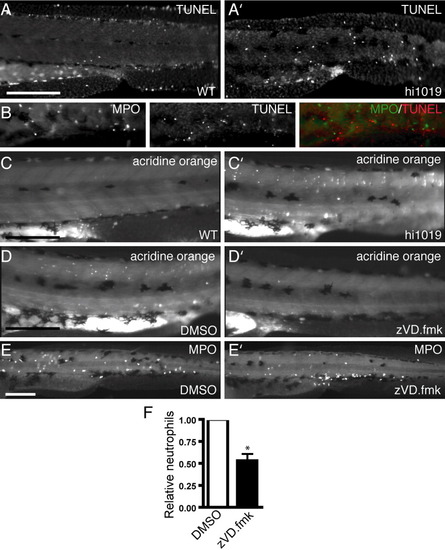
Apoptosis or caspase activity is partially responsible for the recruitment of neutrophils to the trunk of fad24hi1019 mutant larvae. A,A′: TUNEL staining in the trunk of WT (A) and fad24hi1019 mutants (A′). B: TUNEL staining in fad24hi1019 mutant coimmunolabeled with MPO. C,C′: Acridine orange staining in the trunk of WT (C) and fad24hi1019 mutant (C′) larvae. D,D′: Acridine orange staining in fad24hi1019 larvae can be blocked by the addition of the pan-caspase inhibitor zVD.fmk (D′) to the larvae water but not by addition of the vehicle control, DMSO (D). E,E′: MPO immunolabeling of DMSO- (E) and zVD.fmk- (E′) treated fad24hi1019 larvae. F: Quantification of neutrophils found in the body of fad24hi1019 larvae when treated with zVD.fmk relative to the vehicle control, DMSO (set to 100%). Average of three replicates analyzed by a paired Student's t-test at a 95% confidence level. *P < 0.05, error bar is standard error of the mean. Lateral view with anterior to the left at 3 dpf. Scale bar = 200 μm. Representative results from three experiments with greater than 10 larvae per condition per experiment. EXPRESSION / LABELING:
PHENOTYPE:
|
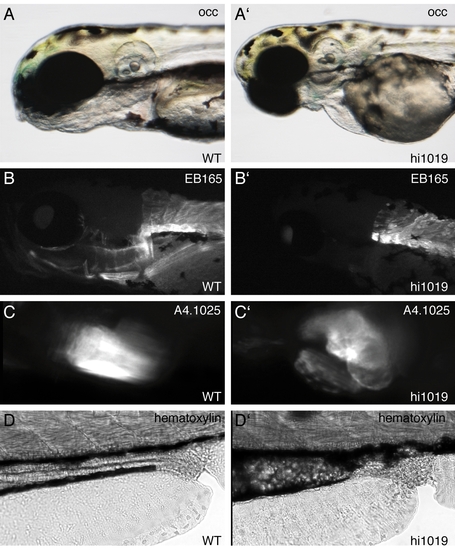
Fad24hi1019 mutants have defects in jaw formation, heart folding, and gut morphology. A-D: WT mutants. A′-D′: fad24hi1019 mutants. A,A′: OCC images of head and jaw of larvae at 3 dpf. B,B′: Immunolabeling of fast-muscle myosin with EB165 revealing musculature of the lower jaw at 3 dpf. C,C′: Immunolabeling with muscle myosin antibody A4.1025 showing heart morphology at 4 dpf. D,D′: Gut morphology in hematoxylin-stained whole-mount larvae at 3 dpf. Lateral view, anterior to the left. Representative results from three experiments. EXPRESSION / LABELING:
PHENOTYPE:
|
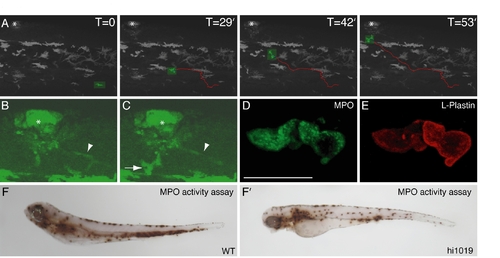
Neutrophils in fad24hi1019 larvae respond to wounds and have active MPO contained in cytoplasmic granules. A: A fad24hi1019;mpx:GFP mutant at 3 dpf was analyzed by time-lapse confocal microscopy. Frames are taken from Supp. Movie 3. The asterisk indicates a wound made in the dorsal fin. A single neutrophil is marked in each frame in green with a red track indicating the path it takes from the body to the fin. Indicated times are from the start of the movie. B: A blown-up image of the wound (taken from Supp. Movie 4) reveals the presence of a low-level MPO-expressing cell with a long and extended morphology (arrowhead). C: Both a low-level MPO-expressing cell with an extended morphology (arrowhead) and a high-level MPO-expressing neutrophil (arrow) can be compared at the wound. Asterisk indicates the wound. D,E: The differential subcellular localization of MPO (D) and L-plastin (E) can be seen in a confocal composite image of two neutrophils from a co-immunolabled fad24hi1019 larva. F,F′: Whole-mount endogenous MPO activity in WT (F) and fad24hi1019 (F′) larvae. Representative results from at least 3 experiments. EXPRESSION / LABELING:
PHENOTYPE:
|

Unillustrated author statements PHENOTYPE:
|