
- Title
-
A dynamic Gli code interprets Hh signals to regulate induction, patterning, and endocrine cell specification in the zebrafish pituitary
- Authors
- Devine, C.A., Sbrogna, J.L., Guner, B., Osgood, M., Shen, M.C., and Karlstrom, R.O.
- Source
- Full text @ Dev. Biol.
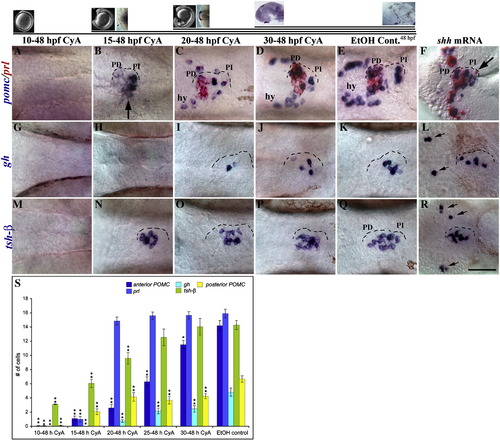
Temporal requirement for Hh signaling in endocrine cell differentiation. (A) Cyclopamine (CyA) treatments from 10 to 48 hpf largely eliminated prl and pomc expressing cells. (B) CyA treatments from 15 to 48 hpf severely reduced the number of prl (red) and anterior pomc expressing cells, while posterior pomc cells were mildly reduced (arrow). (C, D) CyA treatments from 20 to 48 hpf or 30 to 48 hpf had little effect on prl (red) and pomc (blue) cell numbers in the placode, however hypothalamic (hy) pomc cells were reduced in number. (E) Control embryo treated with an equal volume of EtOH (CyA carrier) has normal numbers of prl and pomc expressing cells. (F) shh mRNA injections induced prl and pomc expressing cells ectopically in the anterior brain and in the eye fields. Ectopic prl expressing cells were also seen in the PI (arrow). (G, H) CyA treatments from 10 to 48 hpf or 15 to 48 hpf eliminated gh expressing cells. (I, J) CyA treatments from either 20 to 48 or 30 to 48 hpf moderately reduced gh cell numbers. (K) gh expression in control embryo. (L) Ectopic gh expressing cells (arrows) were seen in 21% of shh mRNA injected embryos (n = 42), although the overall number of cells was largely unaffected. (M) CyA treatments from 10 to 48 hpf eliminated tsh-β expressing cells. (N–P) tsh-β cell numbers were mildly reduced by CyA treatments from 15 to 48 and 20 to 48, but unaffected by treatments from 30 to 48 hpf. (Q) Normal tsh-β cell numbers in a control embryo. (R) shh mRNA injections led to ectopic populations of tsh-β cells in the eye field (arrows). (S) Graph showing the number of cells expressing endocrine genes in these experiments, ± standard error. Significance was calculated for changes in cell number relative to controls. *p < 0.05; **p < 0.01. A minimum of 20 embryos were scored for each treatment. (A–R) Ventral views of 48 hpf embryos, anterior to the left. Scale bar: A–Q; 25 μm, R; 35 μm. Top is a time-line of CyA treatments with images of entire embryo and/or lim3 expression in the adenohyphysis at each corresponding age. |

gli expression in the developing pituitary placode. (A, E, I) At 15 hpf (11 somites), gli1, gli2a and gli2b are all expressed in epidermal cells at the ANR of the embryo that will form the pituitary (arrows). (B, F, J) At 18 hpf (18 somites), gli1 gli2a, and gli2b expression all overlap with pitx3 expression (B inset) at the ANR. gli3 is expressed in adjacent neural ectoderm but not in the developing pituitary placode (F, inset). (C, G, K) At 21 hpf (24 somites) gli1, gli2a, and gli2b expression is continuous across the ANR and gli3 is still absent (G, inset). (D) At 30 hpf gli1 expression is maintained in the anterior region of the placode, the pars distalis (arrow), but is reduced in the posterior region, the pars intermedia (arrowhead).(H, L) At 30 hpf gli2a and gli2b are expressed posteriorly in the PI (arrowheads), but not in the pars distalis (arrows). (A–C, E–G, I–K) Dorsal views, anterior left. (D, H, L) Lateral views of the ventral forebrain, anterior to the left, eyes removed. Red dashed lines show border between developing placodal cells and neural ectoderm of the diencephalon. Scale bar: A–C, E–G, I–K; 100 μm, D, H, L; 30 μm. EXPRESSION / LABELING:
|
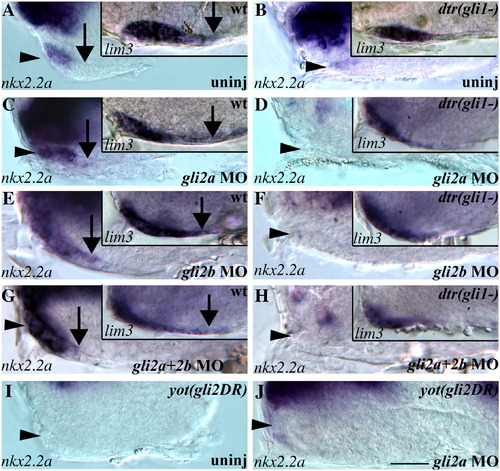
Gli1, Gli2a, and Gli2b contribute to the Hh response in the pituitary. (A) At 30 hpf nkx2.2a is expressed in the PD (arrowhead) but not in the PI (arrow). lim3 (inset) is expressed in both the PD and PI. (B) In dtr(gli1) mutants, nkx2.2a expression is reduced in the PD (arrowhead) and lim3 expression is reduced, indicating a smaller placode (inset). (C) Injecting gli2a morpholinos (MOs) into wildtype embryos led to a posterior expansion of nkx2.2a and lim3 expression (arrows). (D) Injecting gli2a MOs into dtr(gli1) mutants eliminated nkx2.2a expression in the adenohypophysis, but did not further reduce lim3 expression (inset). (E) Injecting gli2b MOs into wildtype embryos led to a posterior expansion of nkx2.2a and lim3 expression (arrows). (F) gli2b MO injections into dtr(gli1) mutants eliminated nkx2.2a expression in the placode, but did not further reduce lim3 expression (inset). (G) Co-injection of gli2a and gli2b MOs led to posterior expansion of nkx2.2a and lim3 expression (arrows). (H) Co-injection of gli2a and gli2b MOs eliminated nkx2.2a expression and reduced lim3 expression. (I) Dominant repressor forms of Gli2a encoded by the yot locus eliminate nkx2.2a expression in the PD. (J) gli2a MO injections into yot(gli2DR) rescued nkx2.2a expression (arrowhead), with expression resembling that seen in dtr(gli1) mutants (compare to panel B). (A–J) Lateral views of the ventral forebrain, anterior to the left, eyes removed. Scale bar: A–J; 30 μm, insets in panels A–H; 40 μm. |
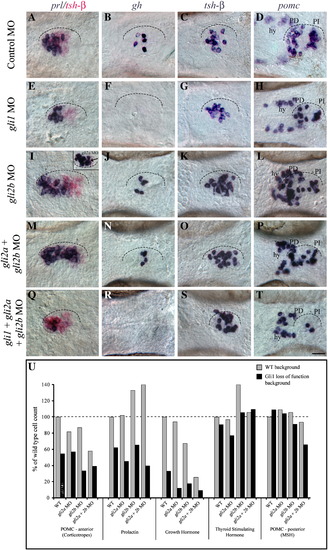
Gli function in endocrine cell determination. (A–D) Normal expression of prl, gh, tsh-β and pomc in the adenohypophysis at 48 hpf (ventral view, anterior left). The adenohypophysis is outlined. (E–H) Loss of Gli1 function either by gli1 MO injection or in dtr(gli1-/-) mutants (not shown) reduced prl (E) and anterior pomc (H) expressing cells and eliminated gh (F) expressing cells. tsh-β (G) and posterior pomc cells (H) were relatively unaffected by loss of Gli1 function. (I–L) In contrast, loss of Gli2b function expanded prl (I) and tsh-β (K) populations, slightly reduced anterior pomc (L) and gh (J) expressing cells, and had little effect on posterior pomc cells (L). Hypothalamic (hy) pomc populations appeared to expand in response to reduced Gli2b function (L). Injection of gli2a MOs also expanded prl cells posteriorly (I, inset) in 40% of embryos examined. (M–P) Simultaneous loss of Gli2a and Gli2b function further expanded prl populations (M), reduced anterior pomc cells (P) and had little effect on gh (N), tsh-β (O) and posterior pomc (P) expressing cells. (Q–T) Loss of Gli1 in combination with loss of Gli2a and Gli2b eliminated the expansion of prl cells seen following Gli2b MO injection (Q), further reduced gh (R) and anterior pomc cells (T), and slightly expanded tsh-β cell numbers (S). (U) Graph showing cell numbers across all Gli loss-of-function experiments, represented as percentage of wild type cell numbers. Gray shading shows the results following injection of gli2 (2a and/or 2b) MOs in a wild type background. Black shading shows the results obtained following injection of gli2 (2a and/or 2b) MOs in a gli1 loss-of-function background. Scale bar: A–T; 25 μm. EXPRESSION / LABELING:
PHENOTYPE:
|
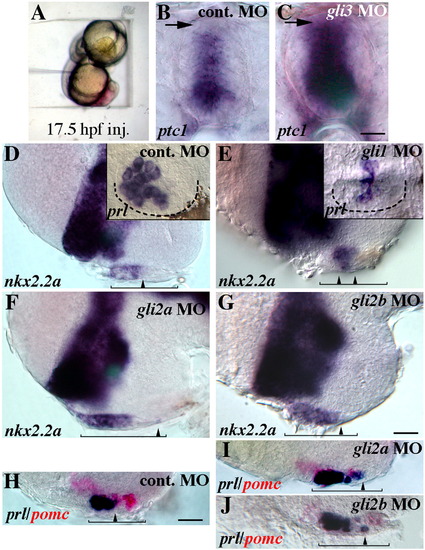
Distinct roles for gli genes in pituitary patterning. (A) To block Gli function at later time periods, 17.5 hpf embryos were placed in agarose wells and antisense oligonucleotides were injected into the space below the developing head. (B, C) Late injection of gli3 MOs led to an expansion of ptc1 into the dorsal spinal cord (arrows, spinal cord shown in cross section), consistent with a loss of Gli3 repressor function. This control experiment shows that Gli activity can be reduced by late MO injections. (D) Normal expression of nkx2.2a and prl (inset, ventral view) following control MO injection at 17.5 hpf. (E) Injection of gli1 MOs reduced anterior expression of both nkx2.2a and prl (inset). (F, G) Late injections of gli2a or gli2b antisense MOs or S-oligos led to a posterior expansion of nkx2.2a expression in the placode (arrowheads). (H) Lateral view of the ventral forebrain showing normal prl (blue label) and pomc (red) expression in the placode of control MO injected embryos. (I, J) Late injection of gli2a or gli2b MOs led to ectopic prl expression in the posterior region of the placode (arrowheads), and to a reduction in posterior pomc expression. (D–J) show 40 hpf embryos, anterior to the left. Black lines show the anterior–posterior extent of the placode with the arrowhead pointing to the most posterior extent of gene expression (nkx2.2a or prl). Dotted lines in D, E insets outline the adenohypophysis. Scale bar: B, C; 20 μm, D-J; 35 μm. |
Reprinted from Developmental Biology, 326(1), Devine, C.A., Sbrogna, J.L., Guner, B., Osgood, M., Shen, M.C., and Karlstrom, R.O., A dynamic Gli code interprets Hh signals to regulate induction, patterning, and endocrine cell specification in the zebrafish pituitary, 143-154, Copyright (2009) with permission from Elsevier. Full text @ Dev. Biol.