
- Title
-
Alpha2 macroglobulin-like is essential for liver development in zebrafish
- Authors
- Hong, S.K., and Dawid, I.B.
- Source
- Full text @ PLoS One
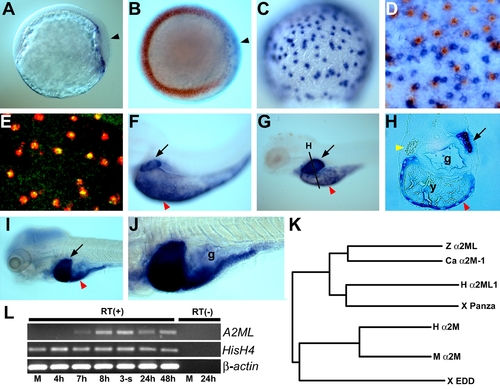
Expression and phylogenic tree analysis of zebrafish A2ML. A–B. Lateral (A) and dorsal view (B) of restricted expression of A2ML under the embryonic shield at 70% epiboly. (B) is double labeled with vent (red). Arrowheads in A and B point to the embryonic shield. C–E. 80% epiboly stage. Lateral view of A2ML expression in the nucleus of YSL cells. (D) Two color in situ hybridization with cas (blue) and A2ML (red). (E) Fluorescence in situ hybridization with tfa (green) and A2ML (red). F. Lateral view of A2ML expression in the liver at 3.5dpf. G–H. Restricted expression of A2ML in liver and yolk (G) and transverse section (H) at 4.5dpf. Yellow arrowhead points to A2ML-negative pancreas rudiment. I–J. Lateral view of A2ML expression at 7dpf. K. Phylogenic tree of A2M family. Ca, carp; H, human; M, mouse; X, Xenopus, Z, zebrafish. See Supplementary Material for accession numbers. L. RT-PCR analysis of A2ML in development; Histone H4 and β-actin were used as controls. Arrows in F–I indicate developing liver, and red arrowheads in F–I point to yolk. g, gut; y, yolk. |
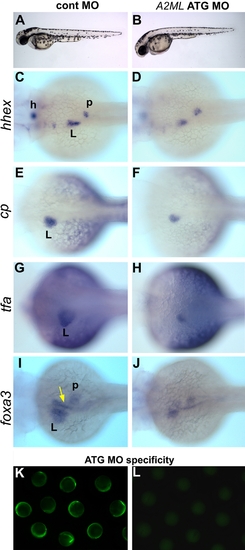
A2ML knock-down phenotype. A2ML ATG MO-injected embryos were at 50 hpf (A–J); embryos in the MO specificity test were at the 3-somite stage (K–L). A–B. Lateral view of live images of control and A2ML ATG MO-injected embryos. C–J. Dorsal views of whole mount in situ hybridization with hhex (C–D), cp (E–F), tfa (G–H), and foxa3 (I–J) of cont MO (C, E, G, I) and A2ML ATG MO (D, F, H, J) injected embryos. A yellow arrow in (I) points to the developing hepatopancreatic duct. K–L. An A2ML-GFP fusion construct was expressed in 95% (n = 40) of embryos after coinjection with control MO, while coinjection of A2ML ATG MO blocked expression of the fusion construct in 95% (n = 55) of embryos. h, heart; L, liver; p, pancreatic primodium. |
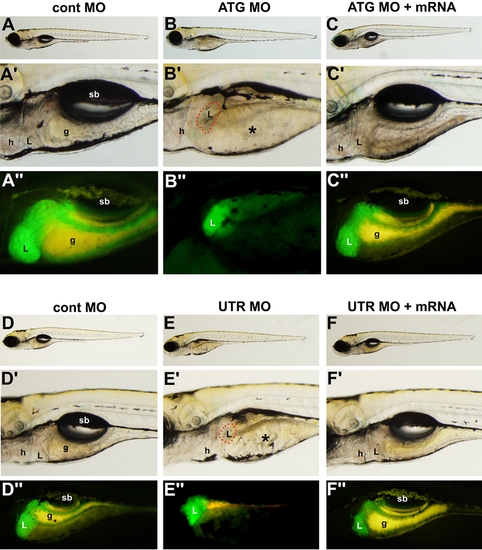
A2ML MOs affect liver formation. Embryos from the ef1a-GFP transgenic line are shown at 5dpf. A–A″. cont MO-injected embryos (95% normal, n = 30). B–B″. A2ML ATG MO-injected embryos showed reduced liver in 90% (n = 45) of cases. C–C″ Rescue of A2ML ATG MO phenotype by co-injection with A2ML mRNA (80% rescued, n = 45). D–D″. Cont MO-injected embryos (99% normal, n = 35). E–E″. A2ML UTR MO injected embryos (98% defect, n = 55). F–F″. Rescue of A2ML UTR MO phenotype by co-injection with A2ML mRNA (90% rescued, n = 47). See Experimental Procedures for injection levels. Red outlines in B′ and E′ represent the small livers remaining in these embryos. Asterisks in B′ and E′ identify yolk. g, gut; h, heart; L, liver; sb, swim bladder. |
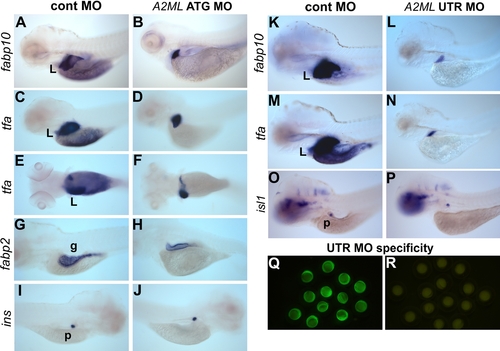
Whole mount in situ hybridization of A2ML knock-down embryos. The indicated MOs were injected and embryos were stained at 5dpf A–J or 6dpf K–P. A, B, K, L. Lateral views of fabp10-stained embryos. C–F, M–N. Lateral (C, D, M, N) and dorsal views (E–F) of tfa expression. G–H. Lateral views of fabp2 expression. I–J. Lateral view of insulin expression, and O–P. islet1 expression in the pancreas. Q–R. Specificity test using the UTR MO at the 3-somite stage; see Fig. 2K–L. |
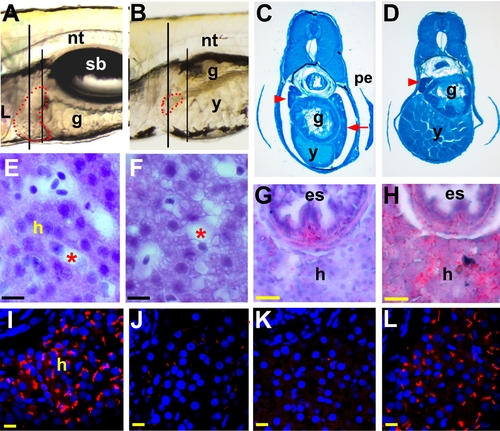
A2ML knock-down phenotypes in the liver. Embryos injected with cont MO (A, C, E, G, I), A2ML ATG MO (B, D, F, H, J), A2ML UTR MO (K), and embryo rescued by co-injection of ATG MO and mRNA (L) were analyzed at 5.5 dpf. (C–F) plastic sections, (G–L) cryosections. A–B Lateral live images in the area of the liver (indicated by red dotted line); the short vertical line indicates the plane of section for C and D, the long line for E–L. C–D Methylene blue stain. Red arrowhead points to pancreas, red arrow to liver (in C). E–F Hematoxylin and Eosin (H&E) stained liver section. Asterisks are sinusoids. G–H Lipid staining of liver using Oil-Red O for cont MO (G) and A2ML ATG MO-injected embryos (H). I–L Confocal images for P-glycoprotein IHC; either MO eliminates P-glycoprotein staining (J and K), while mRNA coinjection rescues staining (L). Scale bars represent 10 μm in E–F and 50 μm in G–L. g, gut; h, hepatocytes; L, liver; n, notochord; pe, pectoral fin; y, yolk. PHENOTYPE:
|
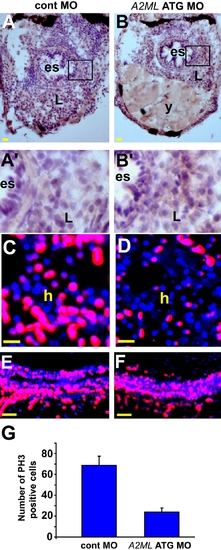
TUNEL and PH3 staining in A2ML ATG MO-injected embryos. All embryos were at 5 dpf. A–D are transverse section, and E–F sagital section. A–B′ TUNEL staining of cont MO-injected embryo (A), and knock-down embryo (B). Areas in open square in A and B are magnified in the A′ and B′. C–D Confocal images of sections stained with anti-PH3ser10 antibody. E–F PH3 staining in the intestine in cont MO (E) and in A2ML ATG MO-injected embryos (F). G Quantification of PH3-positive liver cells. Scale bars in (A and B) 20 μm, and in (C–F) 50 μm. es, esophagus; L, liver; y, yolk. PHENOTYPE:
|
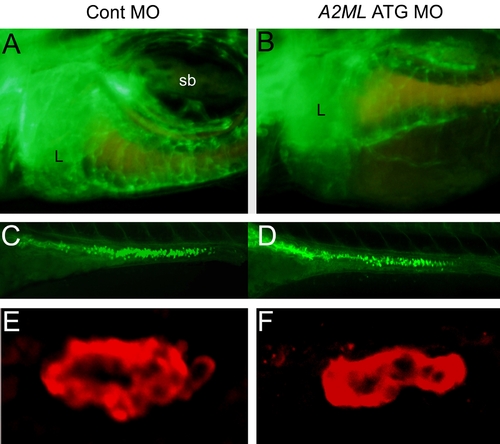
Development of blood vessels, goblet cells, and exocrine pancreas. Embryo stages are 5 dpf for A–D, and 4dpf for E–F. A–B. Blood vessel formation of control MO (A) and A2ML MO (B) injected embryos as visualized in fli1-gfp Tg embryos. C–D. Confocal images of goblet cells in intestine were obtained using fluorescein-conjugated wheat germ agglutinin in control MO (C) and A2ML MO (D) injected embryos. E–F. Confocal images of immunoreactive carboxypeptidase A showing exocrine cells in the pancreas in cont MO (E) and A2ML MO (F) injected embryos. L, liver. |

Unillustrated author statements |