
- Title
-
Rho-kinase and myosin II affect dynamic neural crest cell behaviors during epithelial to mesenchymal transition in vivo
- Authors
- Berndt, J.D., Clay, M.R., Langenberg, T., and Halloran, M.C.
- Source
- Full text @ Dev. Biol.
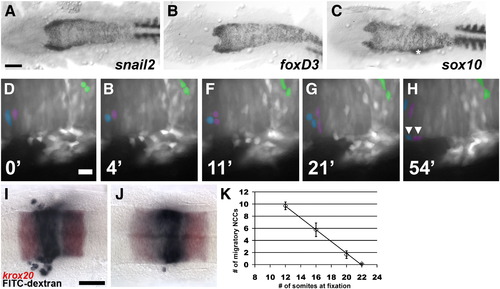
NCCs arise from the neuroepithelium. (A–C) In situ hybridization for myoD and snail2 (A), foxD3 (B), and sox10 (C) at the 8 somite stage, 13 hpf. Asterisk indicates gene expression in the otocyst in C. (D–H) Epifluorescent images from a time-lapse sequence of a Tg(foxD3:gfp) embryo at the 15 somite stage, 16.5 hpf, showing half the neuroepithelium in the region of rhombomeres 5 and 6. Dividing cells and their daughters are pseudocolored. Arrowheads in H indicate daughters of two divisions that migrate to the edge of the neuroepithelium. Time is in minutes. (I–J) Examples of embryos fixed at the 12 somite stage (I) and the 20 somite stage (J) after photo-uncaging of FITC-dextran 2 h earlier in rhombomere 4. Embryo is labeled for uncaged FITC (purple) and krox20 (red). K) Plot of the number of migratory NCCs at various ages 2 h post uncaging. All are dorsal views, anterior left. Scale bar = 100 μm for A–C; 20 μm for D–H; and 40 μm for I, J. EXPRESSION / LABELING:
|
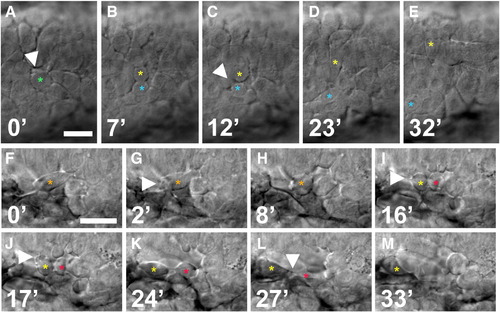
Imaging of cytokinesis in premigratory NCCs. (A–M) Time-lapse sequences in wild-type embryos showing cytokinesis. (A–E) Dorsal views of rhombomere 2 dorsal neuroepithelium. Parent cell is labeled with green asterisk before division and daughters are labeled with blue and yellow asterisks. A parent cell blebs extensively before division (arrowhead in A). Arrowhead in C indicates a filopodium extended from daughter cell. (F–M) Lateral views of cytokinesis in a mesenchymal NCC adjacent to rhombomere 3. Parent cell is labeled with orange asterisk and daughters with red and yellow asterisks. Arrowhead in G indicates blebbing during cell rounding. Arrowhead in I indicates filopodial protrusion prior to the completion of cytokinesis. Arrowhead in J indicates blebbing after cytokinesis. Arrowhead in L indicates a narrow intercellular bridge connecting daughter cells. Time is in minutes. Scale bars = 20 μm. |
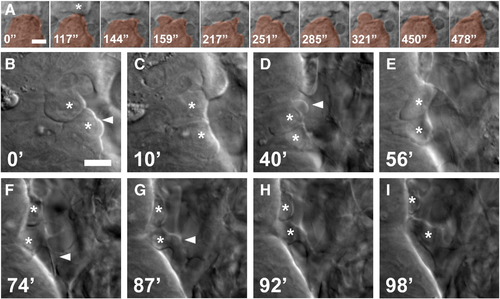
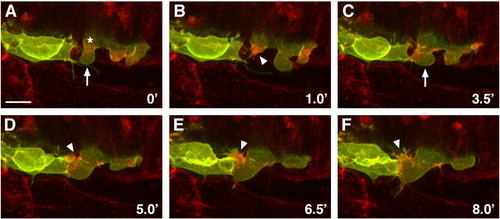
Blebbing and filopodial protrusion occur during the NCC EMT. (A) Time-lapse sequence showing loss of cell adhesion and onset of blebbing in cell pseudocolored orange. Asterisk indicates a neighboring cell. Time is in seconds. (B–I) Time-lapse sequence showing dorsal view of NCCs undergoing EMT at the edge of the neuroepithelium. NCCs undergo blebbing (arrowheads in B, D) followed by migration out of the neuroepithelium accompanied by filopodial and lamellipodial extensions (arrowheads in F, G). Dorsal views of the basal edge of rhombomere 2/3, anterior is up, embryo is approximately 17 hpf. Time is in minutes. |
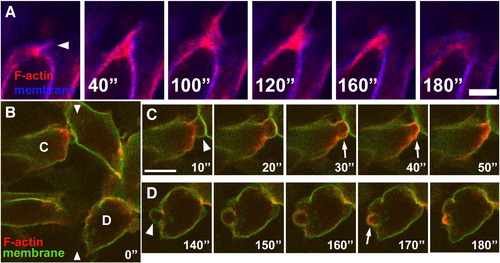
Actin dynamics in protrusions of neuroepithelial cells undergoing EMT. (A) Time-lapse sequence showing that F-actin localization coincides with membrane protrusion during filopodial extension (arrowhead). Cells are expressing GPI-GFP to label membranes (blue) and RFP-UtrCH to label F-actin (red). Dorsal views of basal edge of rhombomere 5/6, anterior is left, embryo is approximately 16 hpf. (B–D) Cells labeled with GPI-GFP (green) and RFP-UtrCH (red) showing actin dynamics in blebs during EMT. B shows location of cells shown in time-lapse in C and D. Arrowheads in B delineate approximate location of edge of neuroepithelium. (C) Cell within the neuroepithelium blebbing at the basal surface. (D) Cell delaminating from the neuroepithelium. During extension, blebs do not contain actin (arrowheads in C, D). During bleb retraction, actin accumulates beneath the membrane (arrows in C, D). Dorsal view of basal edge of rhombomere 4, anterior is up, embryo is approximately 14 hpf. Time is in seconds. Scale bars = 5 μm for A and 10 μm for B–D. |
Actin dynamics in blebs and lamellipodia in NCCs during EMT. Time-lapse sequence of NCCs at the edge of the neuroepithelium in embryos injected with sox10:CAAX-GFP DNA and RFP-UtrCh mRNA. (A) Cell marked with asterisk extends a bleb (arrow). (B) The bleb fills with actin signal upon retraction (arrowhead). (C) The cell blebs again (arrow). (D–F) The cell moves into the bleb while forming actin-filled lamellipodium and filopodia (arrowheads). Images are confocal projections. Dorsal views, anterior left. Scale bar = 10 μm. |
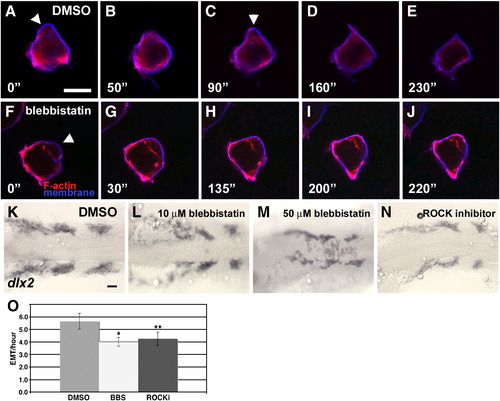
Inhibition of myosin II or ROCK disrupts blebbing and causes defects in NCC EMT. (A–J) Time-lapse sequences of cells expressing GPI-GFP (membranes, blue) and RFP-UtrCH (F-actin, red) in vehicle treated (DMSO) (A–E) or 50 μM blebbistatin-treated (F–J) embryos. Arrowheads in A, C indicate normal blebs. Arrowhead in F indicates bleb that fails to retract after blebbistatin treatment. Dorsal view adjacent to rhombomere 2, anterior is right. Time is in seconds. (K–N) In situ hybridization for dlx2 in embryos treated with DMSO (K), or 10 μM (L) or 50 μM (M) blebbistatin, or 50 μM ROCK inhibitor (N). Dorsal views, anterior left. (O) Number of cells undergoing EMT per hour during 2 h movies. Blebbistatin (BBS) and ROCKi were at 50 μM. Scale bar = 10 μm for A–J and 40 μm for K–N. EXPRESSION / LABELING:
|
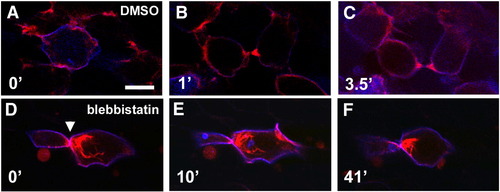
Myosin II activity is required for cytokinesis. (A–F) Time-lapse sequences of cells expressing GPI-GFP (membrane, blue) and RFP-UtrCH (F-actin, red) in embryos treated with DMSO (A–C) or 50 μM blebbistatin (D–F). Arrowhead in D indicates site of cell fission. Time is in minutes. Scale bar = 10 μm. |
Reprinted from Developmental Biology, 324(2), Berndt, J.D., Clay, M.R., Langenberg, T., and Halloran, M.C., Rho-kinase and myosin II affect dynamic neural crest cell behaviors during epithelial to mesenchymal transition in vivo, 236-244, Copyright (2008) with permission from Elsevier. Full text @ Dev. Biol.