
- Title
-
Functional resolution of duplicated hoxb5 genes in teleosts
- Authors
- Jarinova, O., Hatch, G., Poitras, L., Prudhomme, C., Grzyb, M., Aubin, J., Bérubé-Simard, F.A., Jeannotte, L., and Ekker, M.
- Source
- Full text @ Development
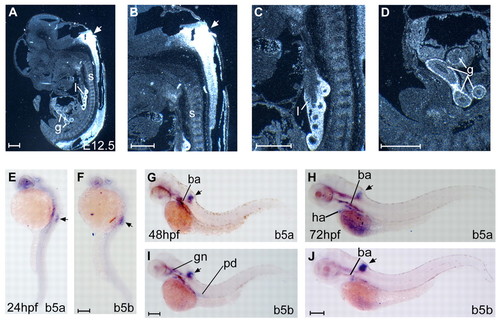
Embryonic expression of mouse and zebrafish Hoxb5 genes. (A-D) Sagittal sections of E12.5 mouse embryos. The antisense Hoxb5 probe consisted of a 430 bp fragment from the Hoxb5 cDNA that includes the N-terminal part of the Hoxb5 protein (Krumlauf et al., 1987). (E-J) Whole-mount in situ hybridization on (E,F) 24 hpf, (G,I) 48 hpf and (H,J) 72 hpf zebrafish embryos using antisense riboprobes for hoxb5a (b5a, 550 bp probe) and hoxb5b (b5b, 600 bp probe). Zebrafish embryos are shown as lateral views. Arrows point to the embryonic neural tube. ba, branchial arches; g, gut; gn, trigeminal ganglion; l, lung; pd, pronephric duct; s, somites. Scale bars: 500 μm in A-D; 250 μm in E-J. EXPRESSION / LABELING:
|
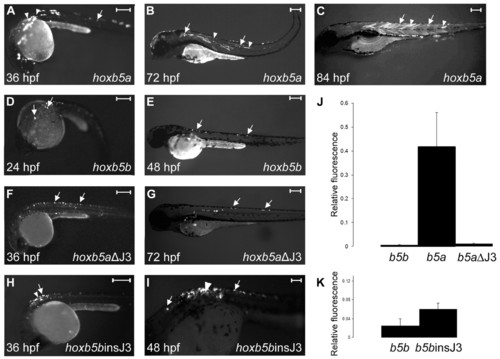
Expression of EGFP reporter transgenes in zebrafish embryos. (A-I) Lateral views (anterior to the left) of primary transgenic zebrafish embryos injected with (A-C) hoxb5aEGFP, (D,E) hoxb5bEGFP, (F,G) hoxb5aΔJ3EGFP or (H,I) hoxb5binsJ3EGFP. Developmental stages are indicated. Arrows indicate cells of the developing nervous system; arrowheads mark somites and muscle cells. Approximately 60% of the embryos injected with hoxb5bEGFP and 50% of embryos injected with hoxb5binsJ3EGFP showed EGFP expression, as compared with only 30% of hoxb5bEGFP and 37.5% of hoxb5aΔJ3EGFP embryos. Scale bars: 250 μm. (J,K) Relative copy numbers of EGFP transcripts detected by RT-PCR in primary transgenic embryos injected with hoxb5aEGFP (b5a), hoxb5bEGFP (b5b), hoxb5aΔJ3EGFP (b5aΔJ3) or hoxb5binsJ3EGFP (b5binsJ3) constructs. Column heights represent relative copy numbers of EGFP transcripts after normalization to endogenous hoxb5a expression. Each bar represents the average of three groups of transgenic embryos and error bars indicate s.e.m. |
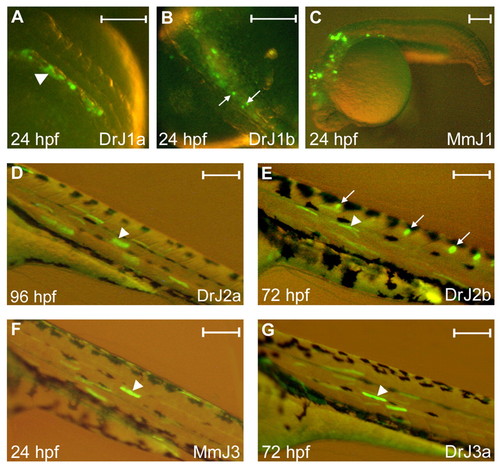
Enhancer activity of individual Hoxb5 non-coding elements in transgenic zebrafish. (A-G) Lateral views, anterior to the left. Arrows in B and E indicate cells of the developing CNS. Arrowheads indicate somites in A and muscle cells in D-G. The name and origin of each regulatory element are indicated as in Fig. 7. Age, in hpf, is indicated. Scale bars: 500 μm. |