FIGURE SUMMARY
Title

The identification of zebrafish mutants showing alterations in senescence-associated biomarkers

Authors
Kishi, S., Bayliss, P.E., Uchiyama, J., Koshimizu, E., Qi, J., Nanjappa, P., Imamura, S., Islam, A., Neuberg, D., Amsterdam, A., and Roberts, T.M.
Source
Full text @ PLoS Genet.

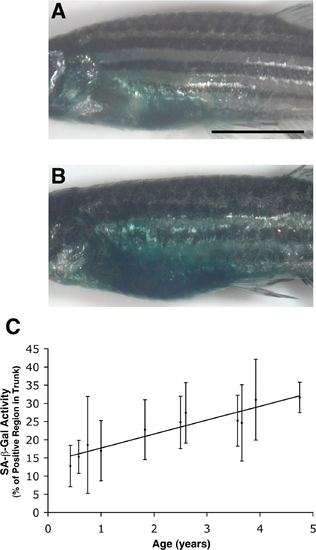
SA-β-gal activity in the trunk skin of the adult zebrafish increases with age.
(A, B) Lateral imaging of 5-month (0.42 y) old (A) and 57-month (4.75 y) old (B) whole adult zebrafish stained for SA-β-gal activity. (C) Quantitative analysis of trunk SA-β-gal staining in fish of various ages showing a near-linear increase in SA-β-gal activity with age. Quantitation was done via image analysis using Adobe Photoshop as described in Materials and Methods and documented in the Supporting Information (Figure S1). The numbers of fish at each time point (years) were: 0.42 y (n = 16); 0.58 y (n = 14); 0.75 y (n = 13); 1 y (n = 14); 1.83 y (n = 15); 2.5 y (n = 6); 2.6 y (n = 8); 3.58 y (n = 14); 3.66 y (n = 12); 3.92 y (n = 22); 4.75 y (n = 5). R2 = 0.3027. y; year(s) of age. (Scale bar: 0.5 cm.)

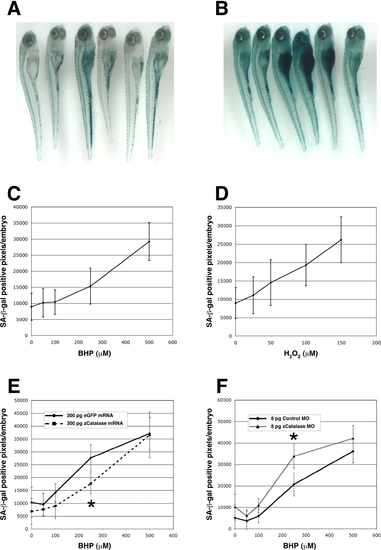
Induction of embryonic SA-β-gal activity by oxidative stress.
(A–D) Embryos treated with 500 μM BHP from 6 hpf to 6 dpf (B) have higher SA-β-gal activity than untreated embryos (A). Plots of the colorimetric quantitation of SA-β-gal staining show a near-linear increase of SA-β-gal activity with increased oxidative stress by BHP (C) or hydrogen peroxide (H2O2) (D). (E) Catalase overexpression can reduce SA-β-gal induction in embryos treated with moderate amounts of oxidative stress. Embryos injected with 300 pg of catalase mRNA at the one cell stage show significantly less SA-β-gal activity at 6 dpf than those injected with a control mRNA following incubation with 350 μM BHP from 6 hpf to 6 dpf. (F) Knockdown of endogenous catalase sensitizes embryos to oxidative stress-dependent SA-β-gal induction. Embryos injected with 8 ng of an antisense morpholino (MO) for catalase show a significant increase in SA-β-gal activity at 6 dpf when stressed with 350 μM BHP from 6 hpf to 6 dpf. *P<0.05 (Student t-test).

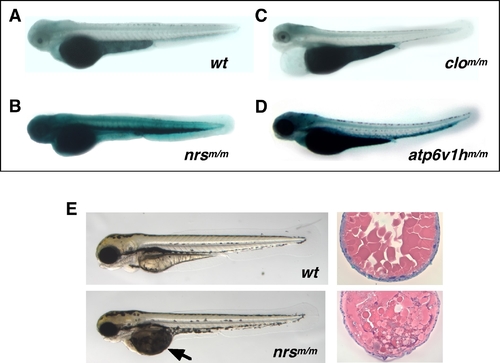
Mutant nrs zebrafish show extremely high SA-β-gal activity and display both yolk and muscle phenotypes.
3.5-day old (3.5 dpf) homozygous nrsm/m (hi891/hi891) zebrafish embryos show extremely high SA-β-gal activity (B) compared with wild-type embryos (A) (with PTU). The atp6v1hm/m (hi923/hi923) mutant shown in (D) is another variant identified as having significantly higher SA-β-gal activity. Most other early embryonic lethal mutants derived from either insertional mutagenesis (as shown in Figure S4) and chemical mutagenesis (e.g., clom39/m39 which is shown in (C)) show no higher (or indistinguishable) SA-β-gal activity than wild-type siblings at any time during development. (E) Yolk opaque phenotypes can be observed in homozygous nrsm/m embryos at 3.5 dpf (earliest detection at around 2.5 dpf; lower left panel), compared with wild-type embryos (upper left panel). Also shown is a comparison between the H&E staining of transverse sections of the yolk part of nrsm/m embryos at 3.5 dpf (lower right panel) and wild-type embryos (upper right).

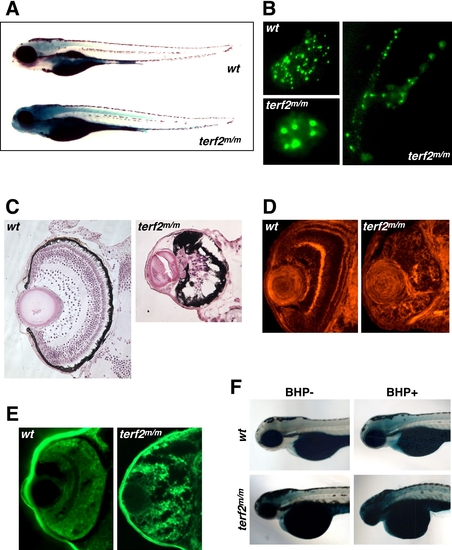
Mutant terf2 animals with high SA-β-gal activity and retinal neurodegenerative phenotypes.
(A) 4.5-day old (4.5 dpf) homozygous terf2m/m zebrafish larvae show high SA-β-gal activity, particularly in the brain and spinal cord, having the small eyes and head (lower image), compared with wild-type (upper image). (B) Abnormally enlarged telomere speckles (lower left panel) and aberrant nuclear shapes (right panel) can be observed in homozygous terf2m/m embryos, compared with normal telomere speckles in a nuclear of the wild-type embryo (upper left panel) at 5 dpf. (C) H&E staining of transverse sections through the retinas of homozygous terf2m/m (right panel) and wild-type zebrafish embryos (left panel) at 5 dpf. (D) Embryonic zebrafish retinas were stained with phalloidin to visualize the actin filaments in the plexiform layers, which revealed obvious structural defects in the homozygous terf2m/m mutant (right panel) compared with a wild-type sibling (left panel) at 3 dpf. (E) Neurodegeneration in the retina was histologically detected by performing Fluoro-Jade B staining in homozygous terf2m/m mutant (right panel), but was not evident in the wild-type embryo (left panel) at 2 dpf. (F) Homozygous terf2 mutant embryos and wild-type controls were exposed to 350 μM BHP from 6 hpf to 4 dpf. Enhanced SA-β-gal staining with a more severe morphology in eyes and heads are observed in BHP-treated terf2 mutant embryos at 4 dpf (lower right panel).

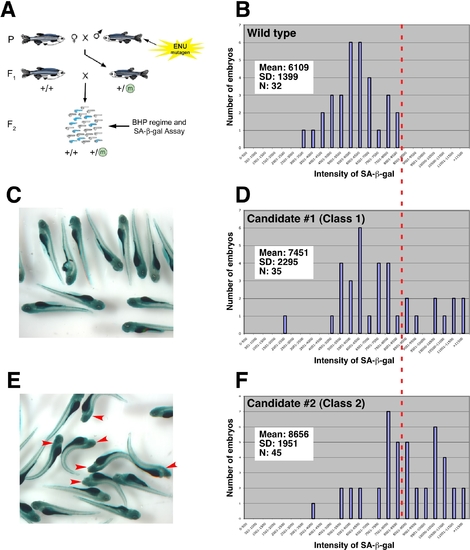
CASH screening methodology and mutant candidate identification.
(A) Schematic representation of mutagenized wild-type male zebrafish bred with wild-type females. Males from the resultant F1 generation are raised and outcrossed with wild-type females. The resultant embryo clutches will be 50% wild type and 50% heterozygous with respect to a mutation generated in the parental (P) gametes. These F2 embryos are treated with moderate levels of BHP and stained for SA-β-gal activity (C). Quantitation of the staining levels is then performed. Embryo counts are grouped into 500-pixel intensity cohorts and plotted. (B) Wild-type embryos show a tight Gaussian distribution of staining intensity. Significantly right-shifted distributions (dotted red line in D) identify Class 1 candidates in terms of their oxidative stress sensitivity (D). Class 2 mutant candidates are identified if direct phenotypic abnormalities (red arrows) exist in approximately 50% of the embryos of clutches only in the presence of exogenous oxidative stress (an example is shown in E and F), with significantly right-shifted distributions (dotted red line in F).

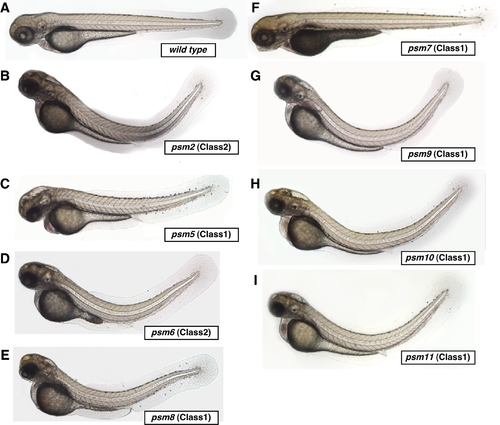
Homozygous psm mutant zebrafish embryos and their respective classes.
Shown are a wild type embryo (A), and psm2 (B), psm5 (C), psm6 (D), psm8 (E), psm7 (F), psm9 (G), psm10 (H), and psm11 (I) mutant embryos (with PTU). Neurodegenerative mutants (psm2, 5, 6, 8, 9, 10, 11) have opaque regions in the head and obvious dorsal curvature by 3.5 dpf as homozygotes. The homozygous muscle atrophy mutant psm7 is accompanied by an opaque yolk and a slightly protruding jaw. Class 1 mutants (psm5, 7, 8, 9, 10 and 11) were revealed by our oxidative stress CASH screen as candidates that displayed high SA-β-gal activity in heterozygotes when stressed with 350 μM BHP from 6 hpf to 6 dpf. Class 2 mutants (psm2 and 6) showed obvious SA-β-gal activity, but morphologically abnormal phenotypes in heterozygotes when stressed with 350 μM BHP from 6 hpf to 6 dpf in the CASH screen.

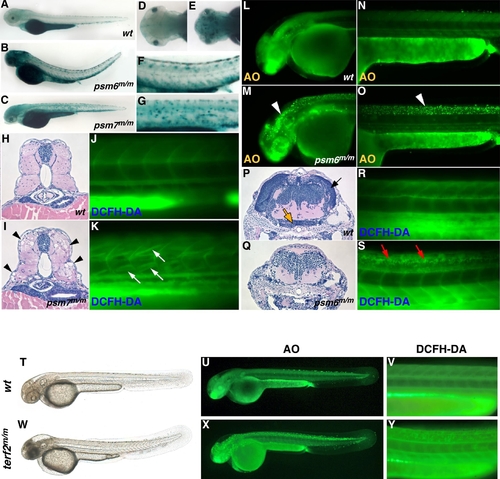
Senescence, cell death and ROS generation in homozygous psm zebrafish mutants in the absence of oxidative stress.
SA-β-gal activity was found to be high throughout the brain and neural tube in neurodegenerative zebrafish mutants (B and the magnified trunk region in F) [psm6m/m is shown] compared with wild-type embryos (A) at 3.5 dpf (with PTU). (D, E) Dorsal views of the head of wild-type and psm6m/m embryos respectively. (G) Neurodegenerative mutant embryos have high levels of acridine orange (AO) staining (white arrowheads) in the brain (M) and neural tube (O), compared with wild-type embryos (L, N) at 2 dpf. H&E staining of transverse sections of the head of 5-day old (5 dpf) larvae reveals a reduction in the number of neuronal nuclei and absence of brain structures in neurodegenerative mutants (Q), compared with wild-type embryos (arrows in P which indicate the tectum opticum [black arrow] and caudal hypothalamus [orange arrow]). DCFH-DA staining indicates high ROS generation in the neural tube of neurodegenerative mutants (red arrows in S) compared with wild-type embryos (R) at 3.5 dpf. The muscle atrophy mutant [psm7m/m is shown] is characterized by punctate SA-β-gal activity in the trunk (C and magnified trunk region in G). H&E staining of transverse sections of the trunks of 4-day old (4 dpf) psm7m/m larvae reveals the loss of muscle fibers (black arrowheads in I), compared with wild-type embryos (H). DCFH-DA staining reveals the generation of ROS in skeletal muscle in the absence of exogenous oxidative stress in psm7m/m embryos (white arrows in K) compared with wild-type embryos (J) at 3.5 dpf. Morphology of terf2m/m mutant embryo was compared with that of wild-type sibling (T, W) at 2 dpf (with PTU). terf2m/m mutant embryos have high levels of acridine orange (AO) staining (X) in the brain and neural tube, compared with wild-type embryos (U) at 2 dpf. DCFH-DA staining indicates high ROS generation in the neural tube of terf2m/m mutant (Y) compared with wild-type embryos (V) at 3.5 dpf.

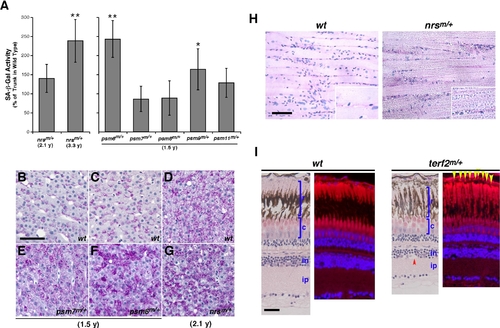
Heterozygous mutant zebrafish with increased SA-β-gal activity and elevated levels of aging biomarkers in adults.
(A) The heterozygous nrsm/+ mutants showed significantly increased SA-β-gal activity in the skin compared with their wild-type siblings at 3.3 y, but not before 2.1 y (right side graph). Two psm mutants (psm6 and psm9) also showed significantly increased SA-β-gal activity in the skin as heterozygotes, compared with their wild-type sibling counterparts at just 1.5 y (left side graph). *P<0.05; **P<0.01 (Student t-test). (B–G) Shown here are liver sections from a 1.5 y psm7m/+ heterozygote and a wild-type sibling (E and B, respectively), and a 1.5 y psm6m/+ heterozygote and a wild-type sibling (F and C, respectively). All of the heterozygous male psm6m/+ (n = 8) and psm7m/+ (n = 6) mutants analyzed show increased lipofuscin accrual in the liver. Representative liver sections from a 2.1 y nrsm/+ heterozygote and a wild-type sibling are also shown (G and D, respectively) (n = 5 for each). (H) Heterozygous aged nrsm/+ mutants show increased lipofuscin accrual in the skeletal muscle (n = 8 for mutants; n = 5 for wild-type siblings). Longitudinal trunk muscle sections from a 33-month (2.8 y) nrsm/+ heterozygote mutant and a wild-type sibling are shown (left and right panels, respectively), with enlarged images included as insets. (I) Heterozygous and older (23-month old) terf2m/+ mutants show a decreased thickness of the retina, particularly in the photoreceptor layer and inner plexiform layer, compared with age-matched wild-type siblings. Heterozygous older (23-month old) terf2m/+ mutants show increased drusen-like accruals (yellow arrows) with autofluorescence surrounding the RPE area and both more and larger empty space(s) (red arrow) in the inner nuclear layer when compared with an age-matched wild-type sibling. (Scale bar: 100 μm.)

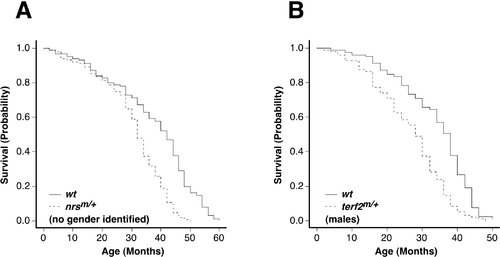
Heterozygous nrs and terf2 mutant zebrafish showing a shorter lifespan in adults.

Shorter lifespan in heterozygous nrsm/+ and terf2m/+ mutants is demonstrated by Kaplan-Meier survival analysis. Survival curves of cohorts of no gender identified heterozygous nrsm/+ (n = 256) and their wild-type siblings (n = 148) (A), and male heterozygous terf2m/+ (n = 79) and their wild-type male siblings (n = 96) (B), are shown.

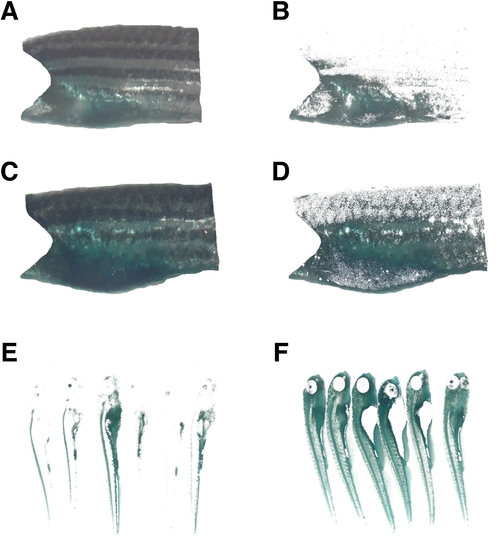
Pixel images for quantitation of SA-β-gal activity in zebrafish. (A–D) Colorimetric quantitation of SA-β-gal activity staining in the trunk sections of adult zebrafish. Lateral photographs were taken, and the area between the operculum and the dorsal and anal fins was chosen for quantitation (A and B). The blue pixel area was calculated (C and D as described in Materials and Methods), and SA-β-gal activity is expressed as a percentage of the total area values. The analysis was performed on both sides of each fish. Shown here are fish aged 5 months (A and C) and 57 months (B and D). E and F: Colorimetric quantitation of SA-β-gal activity in zebrafish embryos. The total blue pixel number was determined from lateral photographs of individual 3.5-day old zebrafish embryos. SA-β-gal staining intensities were quantified in untreated embryos (E) and embryos incubated in 500 mM BHP (F).

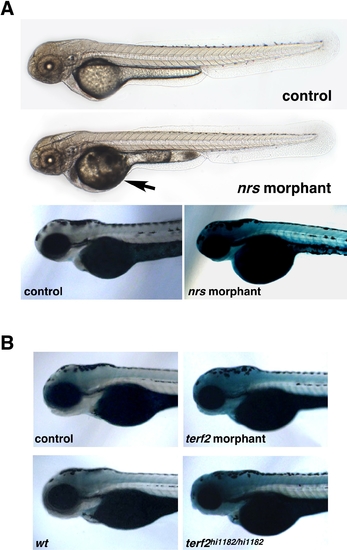
Morpholino-induced knockdown of nrs and terf2 in zebrafish embryos generates phenocopies of the corresponding mutants. (A) nrs morphants show yolk-opaque phenotypes starting at 2.5 dpf (with PTU), which is an exact phenocopy of the nrs mutant embryos which also manifested an obvious yolk-opaque substance. Upon SA-β-gal staining at 3 dpf, an extremely high level of induction was detected in the nrs morphants, in an identical manner to the SA-β-gal levels observed in the nrs mutants, while the control-injected embryos did not show any significant SA-β-gal activity as well as opaque yolks. (B) terf2 morphants (3.5 dpf) show robust SA-β-gal induction having relatively moderate but quite a similar morphological phenotype to the terf2 allele mutant, terfahi1182/hi1182 which has a slightly weaker phenotype than terfahi3678/hi3678.

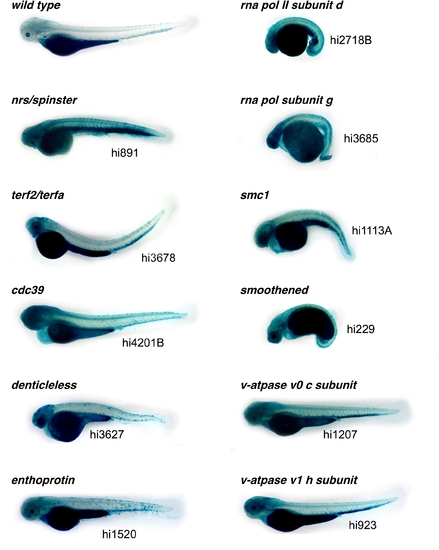
Retrovirus-insertional mutants showing high SA-β-gal activity. The eleven homozygous 3.5 dpf retrovirus-insertional mutants stained with high SA-β-gal are shown in comparison with a wild-type control (with PTU). All of the information we obtained regarding these mutants is summarized in Table 1.

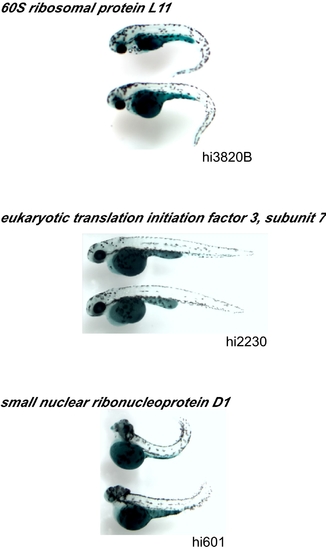
Retrovirus-insertional mutants showing low SA-β-gal activity. There were several low SA-β-gal intensity insertional mutants such as hi3820B (60S ribosomal protein L11 gene) (n = 12; 5 dpf), hi2230 (eukaryotic translation initiation factor 3, subunit 7 gene) (n = 15; 4 dpf), and hi601 (small nuclear ribonucleoprotein D1 gene) (n = 14; 3.5 dpf). Representative SA-β-gal stained homozygous embryos (two individuals from each of these three mutant groups) are shown.

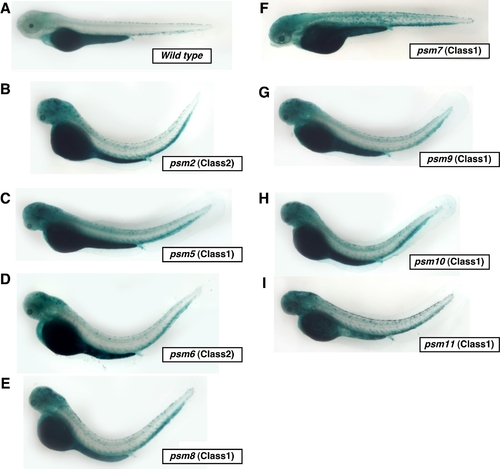
Homozygous psm mutant embryos showing high levels of tissue-specific SA-β-gal activity without oxidative stress. Homozygous 3.5 dpf neurodegenerative zebrafish psm mutants (psm2, 5, 6, 8, 9, 10, 11) show much higher levels of punctate SA-β-gal staining throughout their central nervous system compared with wild-type embryos (with PTU). Of note, the muscle atrophy mutant psm7 shows particularly high levels of punctate staining in the trunk region.

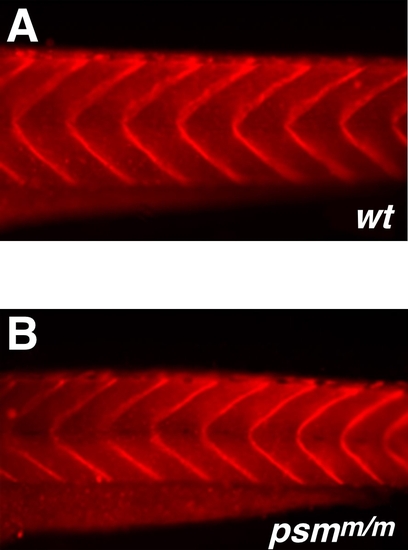
Dystrophin expression is normal in psm7m/m embryos. Immunostaining of dystrophin (red) in muscle myotomes of 3.5 dpf psm7m/m zebrafish embryos (B) is similar to that in wild-type embryos (A), indicating that dystrophin-related muscle attachment is not defective in this mutant. Staining was performed as described by Bassett et al. [67] with the exception that the secondary antibody used was Alexa Fluor 594-conjugated anti-mouse IgG at a 1:1000 dilution.

EXPRESSION / LABELING:
Gene:
Antibody:
Fish:
Anatomical Term:
Stage: Protruding-mouth

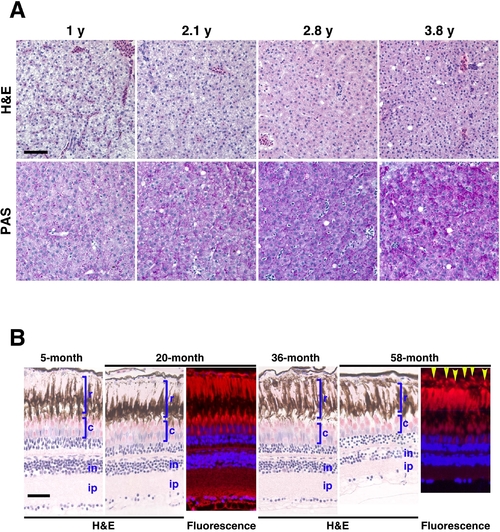
Liver and eye histology in the adult zebrafish with age. (A) Liver sections of 1 y, 2.1 y, 2.8 y, and 3.8 y wild-type zebrafish were stained by H&E or PAS staining. Hepatocyte density and eosinophilic staining can be seen to increase with age by H&E staining. PAS-positive staining for lipofuscin also shows increased levels of this biomarker in aging liver tissue. (B) Eye sections of 5-month, 20-month, 36-month, and 58-month old wild-type fish were stained by H&E. In the light adapted retina, the rods (r) sit distally to the cones (c); ‘in’ indicates the inner nuclear layer, and ‘ip’ indicates the inner plexiform layer. Processes from the pigment epithelium (PE) extend between the outer segments of the rods. Aged (58-month old) wild-type fish show increased drusen-like accruals (yellow arrows) with autofluorescence in the RPE (lower right panel), compared with younger (20-month old) wild-type fish (upper right panel). (Scale bar: 100 μm.)

Unillustrated author statements

Acknowledgments
This image is the copyrighted work of the attributed author or publisher, and ZFIN has permission only to display this image to its users. Additional permissions should be obtained from the applicable author or publisher of the image. Full text @ PLoS Genet.