
- Title
-
Zebrafish orthologue of mental retardation protein IL1RAPL1 regulates presynaptic differentiation
- Authors
- Yoshida, T., and Mishina, M.
- Source
- Full text @ Mol. Cell Neurosci.
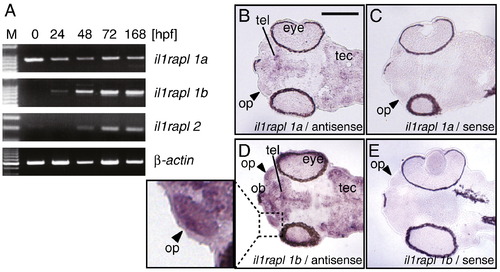
Expression of zebrafish il1rapl genes. (A) Expression of zebrafish il1rapl1a, il1rapl1b and il1rapl2 mRNA in the 0 hpf, 24 hpf, 48 hpf and 72 hpf zebrafish embryos and 168 hpf larva estimated by RT-PCR. The sizes of il1rapl1a, il1rapl1b and il1rapl2 fragments were 825 bp, 828 bp and 211 bp, respectively. β-actin fragment of 490 bp served as a positive control. (B, C) Sections of 60 hpf embryos stained by in situ hybidization with DIG-labeled antisense (B) and sense (C) probes of the zebrafish il1rapl1a mRNA. (D, E) Sections of 60 hpf embryos stained by in situ hybidization with DIG-labeled antisense (D) and sense (E) probes of the zebrafish il1rapl1b mRNA. The dashed region in (D) including the olfactory placode is magnified on the left. eye, eye; ob, olfactory bulb; op, olfactory placode; tec, tectum; tel, telencephalon. Arrowheads point olfactory placodes. Scale bar, 100 μm. |
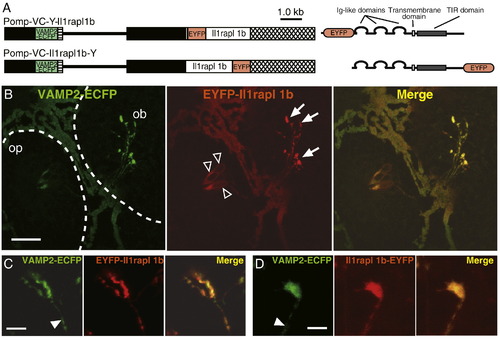
Localization of zebrafish Il1rapl1b tagged with EYFP in developing zebrafish olfactory sensory neurons. (A) Omp promoter-driven expression vectors for EYFP-Il1rapl1b fusion protein and VAMP2-ECFP (Pomp-VC-Y-Il1rapl1b, top) and for Il1rapl1b-EYFP-fusion protein and VAMP2-ECFP (Pomp-VC-Il1rapl1b-Y, bottom) in olfactory sensory neurons. Black boxes, the omp promoter; crosshatched boxes, the 3′ downstream sequence of the omp gene; hatched boxes, SV40 polyadenylation signal sequence; lines, pBluescript II SK+. Schematized structures of EYFP-tagged Il1rapl1b proteins are on the right. (B) Representative VAMP2-ECFP signals (left, green) and EYFP-Il1rapl1b signals (middle, red) in olfactory sensory neurons of Pomp-VC-Y-Il1rapl1b-injected embryos at 60 hpf. These signals are merged on the right. op, olfactory placode; ob, olfactory bulb. Arrows and arrowheads point cell bodies and axon terminals, respectively. Bar = 20 μm. (C, D) Representative VAMP2-ECFP signals (left, green) and EYFP-fusion protein signals (middle, red) in the axon terminal of olfactory sensory neuron of Pomp-VC-Y-Il1rapl1b (C)-or Pomp-VC-Il1rapl1b-Y (D)-injected embryos at 60 hpf. These signals are merged on the right. Arrowheads point axonal shafts. Bar = 5 μm. |
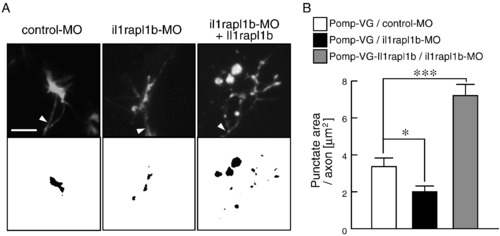
Effect of il1rapl1b-MO on the VAMP2-EGFP punctum formation in axon terminals of olfactory sensory neurons. (A) Representative VAMP2-EGFP signals in olfactory neuron axon terminals of embryos injected with Pomp-VG and control-MO (left), Pomp-VG and il1rapl1b-MO (middle) and Pomp-VG-Il1rapl1b and il1rapl1b-MO (right) at 60 hpf. The threshold images of VAMP2-EGFP signals are on the bottom. Arrowheads point axonal shafts. Bar = 5 μm. (B) The area of VAMP2-EGFP puncta in axon terminals of olfactory sensory neurons of embryos injected with Pomp-VG and control-MO (open bar), Pomp-VG and il1rapl1b-MO (filled bar) and Pomp-VG-Il1rapl1b and il1rapl1b-MO (gray bar) at 60 hpf. n = 56–60 for 31–33 embryos. One-way ANOVA: F = 33.9 and p < 0.001. All values represent mean ± SEM. * and ***, p < 0.05 and< 0.001, respectively. PHENOTYPE:
|
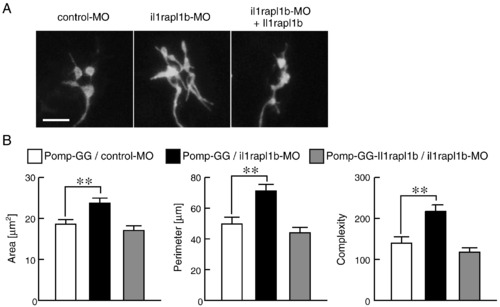
Effect of il1rapl1b-MO on the axon terminal morphology of olfactory sensory neurons. (A) Representative GAP43-EGFP signals in axon terminals of olfactory sensory neurons in zebrafish embryos injected with Pomp-GG and control-MO (left), Pomp-GG and il1rapl1b-MO (middle) and Pomp-GG-Il1rapl1b and il1rapl1b-MO (right) at 84 hpf. Bar = 5 μm. (B) The area (left), perimeter (middle) and complexity (right) values of axon terminals of olfactory sensory neurons in zebrafish embryos injected with Pomp-GG and control-MO (open bars), Pomp-GG and il1rapl1b-MO (filled bars) and Pomp-GG-Il1rapl1b and il1rapl1b-MO (gray bars) at 84 hpf. n = 44–47 for 30 embryos. One-way ANOVA: F = 9.2 and p < 0.001, F = 14.3 and p < 0.001, and F = 14.7 and p < 0.001 for axon terminal area, perimeter and complexity, respectively. All values represent mean ± SEM. **, p < 0.01. PHENOTYPE:
|
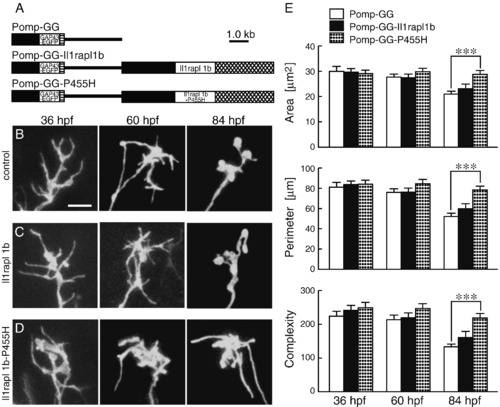
Effect of Il1rapl1b and Il1rapl1b-P455H expression on the axon terminal morphology of olfactory sensory neurons. (A) Omp promoter-driven expression vectors for GAP43-EGFP (Pomp-GG, top), for Il1rapl1b and GAP43-EGFP (Pomp-GG-Il1rapl1b, middle) and for Il1rapl1b-P455H and GAP43-EGFP (Pomp-GG-P455H, bottom) in olfactory sensory neurons. Black boxes, the omp promoter; crosshatched boxes, the 3′ downstream sequence of the omp gene; hatched boxes, SV40 polyadenylation signal sequence; lines, pBluescript II SK+. (B–D) Representative GAP43-EGFP signals in axon terminals of olfactory sensory neurons in zebrafish embryos injected with Pomp-GG (B), Pomp-GG-Il1rapl1b (C) or Pomp-GG-P455H (D) at 36 hpf (left), 60 hpf (middle) and 84 hpf (right). Bar = 5 μm. (E) The area (top), perimeter (middle) and complexity (bottom) values of axon terminals of olfactory sensory neurons in zebrafish embryos injected with Pomp-GG (open bars), Pomp-GG-Il1rapl1b (filled bars) or Pomp-GG-P455H (stippled bars) expression vectors at 36 hpf, 60 hpf and 84 hpf. Pomp-GG, n = 39, 52 and 57 for 31, 38 and 37 embryos at 36 hpf, 60 hpf and 84 hpf, respectively; Pomp-GG-Il1rapl1b, n = 62, 50 and 53 for 35, 36 and 38 embryos at 36 hpf, 60 hpf and 84 hpf, respectively; Pomp-GG-P455H, n = 44, 56 and 45 for 26, 35 and 35 embryos at 36 hpf, 60 hpf and 84 hpf, respectively. Two-way ANOVA: expression vector effect, F = 5.0 and p = 0.0071, F = 9.7 and p < 0.001, and F = 11.2 and p < 0.001 for axon terminal area, perimeter and complexity, respectively. All values represent mean ± SEM. ***, p < 0.001. |
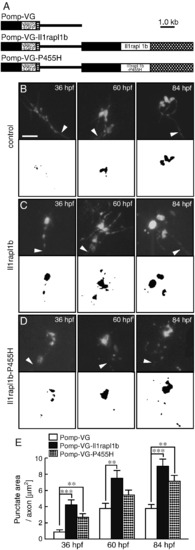
Effect of IL1RAPL 1B and IL1RAPL 1B-P455H expression on the VAMP2-EGFP punctum formation in axon terminals of olfactory sensory neurons. (A) Omp promoter-driven expression vectors for VAMP2-EGFP (Pomp-VG, top), for IL1RAPL 1B and VAMP2-EGFP (Pomp-VG-Il1rapl1b, middle) and for IL1RAPL 1B-P455H and VAMP2-EGFP (Pomp-VG-P455H, bottom) in olfactory sensory neurons. Black boxes, the omp promoter; crosshatched boxes, the 3′ downstream sequence of the omp gene; hatched boxes, SV40 polyadenylation signal sequence; lines, pBluescript II SK+. (B-D) Representative VAMP2-EGFP signals in olfactory neuron axon terminals in Pomp-VG (B)-, Pomp-VG-Il1rapl1b (C)-or Pomp-VG-P455H (D)-injected embryos at 36 hpf (left), 60 hpf (middle) and 84 hpf (right) are shown in the upper panels. The threshold images of VAMP2-EGFP signals are on the bottom. Arrowheads point axonal shafts. Bar = 5 μm. (E) The area of VAMP2-EGFP puncta in axon terminals of olfactory sensory neurons in Pomp-VG (open bars)-, Pomp-VG-Il1rapl1b (filled bars)-and Pomp-VG-P455H (stippled bars)-injected embryos at 36 hpf, 60 hpf and 84 hpf. Pomp-VG, n = 33, 41 and 40 for 25, 29 and 27 embryos at 36 hpf, 60 hpf and 84 hpf, respectively; Pomp-VG-Il1rapl1b, n = 41, 39 and 49 for 25, 27 and 26 embryos at 36 hpf, 60 hpf and 84 hpf, respectively; Pomp-VG-P455H, n = 41, 43 and 44 for 26, 27 and 27 embryos at 36 hpf, 60 hpf and 84 hpf, respectively. Two-way ANOVA, expression vector effect, F = 27.9, p < 0.001. All values represent mean ± SEM. ** and ***, p < 0.01 and< 0.001, respectively. |
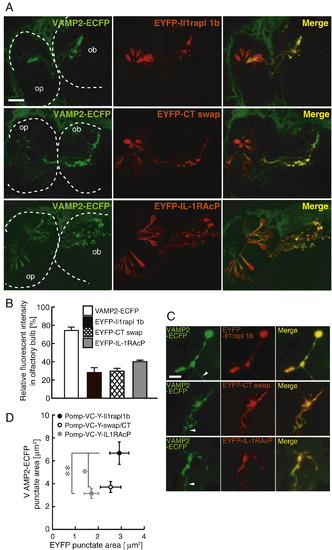
Localization of EYFP-Il1rapl1b, EYFP-CT swap and EYFP-IL-1RAcP in olfactory sensory neurons and effect of these EYFP-tagged proteins on VAMP2-ECFP punctum formation. (A) Representative VAMP2-ECFP signals (left, green) and EYFP-tagged protein signals (middle, red) in olfactory sensory neurons of Pomp-VC-Y-Il1rapl1b (top)-, Pomp-VC-Y-swap/CT (middle)-, or Pomp-VC-Y-IL1RAcP (bottom)-injected embryos at 60 hpf. These signals are merged on the right. op, olfactory placode; ob, olfactory bulb. Bar = 20 μm. (B) The ratios of the EYFP fluorescent intensity in the olfactory bulb to that in both olfactory placode and olfactory bulb were measured in Pomp-VC-Y-Il1rapl1b (black bar)-, Pomp-VC-Y-swap/CT (crosshatched bar)-or Pomp-VC-Y-IL1RAcP (gray bar)-injected embryos. The ECFP fluorescent intensity ratio in Pomp-VC-injected embryos is also shown (open bar). All values represent mean ± SEM. 8–10 embryos. (C) Representative VAMP2-ECFP signals (left, green) and EYFP-tagged protein signals (middle, red) in the axon terminal of olfactory sensory neuron of Pomp-VC-Y-Il1rapl1b (top)-, Pomp-VC-Y-swap/CT (middle)-or Pomp-VC-Y-IL1RAcP (bottom)-injected embryos at 60 hpf. These signals are merged on the right. Arrowheads point axonal shafts. Bar = 5 μm. (D) The punctate areas of VAMP2-ECFP and EYFP-tagged proteins in axon terminals of olfactory sensory neurons in Pomp-VC-Y-Il1rapl1b (filled circle)-, Pomp-VC-Y-swap/CT (open circle)-and Pomp-VC-Y-IL1RAcP (gray circle)-injected embryos at 60 hpf. n = 35–37, 21 embryos. One-way ANOVA for the punctuate area of VAMP2-ECFP and EYFP-tagged proteins, F = 8.0 and p = 0.001, and F = 2.5 and p = 0.09, respectively. All values represent mean ± SEM. * and **, p < 0.05 and < 0.01, respectively. |
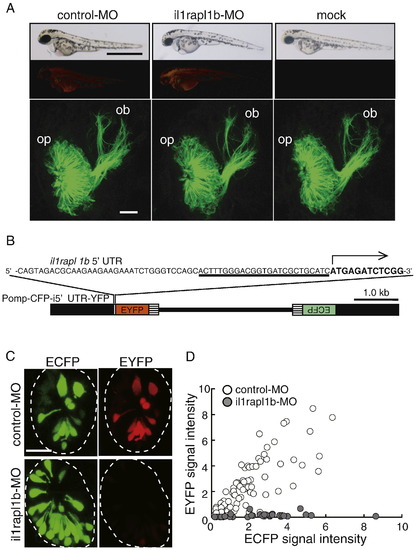
Evaluation of morpholino-mediated protein knockdown. (A) The lateral views of whole zebrafish bodies (top row panels), their lissamine fluorescent signals to monitor the distribution of morpholino oligonucleotides (second row panels) and frontal views of the olfactory placode and bulb (bottom row panels) of control-MO (left panels)-, il1rapl1b-MO (middle panels)-and mock (right panels)-injected embryos carrying the omp promoter-driven tau-EGFP transgene at 60 hpf. Dorsal is to the top and medial is to the right for the bottom panels. Bar = 1 mm for top row panels and 20 μm for bottom row panels. op, olfactory placode; ob, olfactory bulb. (B) Structure of Pomp-CFP-i5′UTR-YFP vector for the evaluation of il1rapl1b-MO-mediated protein knockdown. The target sequence for il1rapl1b-MO is underlined and translation initiation site is indicated as an arrow. Black boxes, the omp promoter; hatched boxes, SV40 polyadenylation signal sequence; lines, pBluescript II SK+. (C) ECFP (left panels) and EYFP (right panels) signals in the olfactory placode of embryos injected with Pomp-CFP-i5′UTR-YFP vector and control-MO (upper panels) and with Pomp-CFP-i5′UTR-YFP vector and il1rapl1b-MO (lower panels) at 84 hpf. (D) ECFP and EYFP fluorescent intensity of individual olfactory neurons in control morphants (open circles) and il1rapl1b morphants (gray circles) at 84 hpf are plotted. n = 79 and 35 for 5 control morphants and 4 il1rapl1b morphants, respectively. PHENOTYPE:
|
Reprinted from Molecular and cellular neurosciences, 39(2), Yoshida, T., and Mishina, M., Zebrafish orthologue of mental retardation protein IL1RAPL1 regulates presynaptic differentiation, 218-228, Copyright (2008) with permission from Elsevier. Full text @ Mol. Cell Neurosci.