
- Title
-
The Met receptor tyrosine kinase prevents zebrafish primary motoneurons from expressing an incorrect neurotransmitter
- Authors
- Tallafuss, A., and Eisen, J.S.
- Source
- Full text @ Neural Dev.
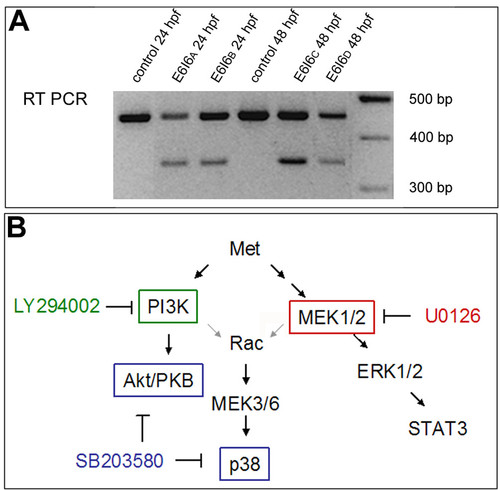
Blocking Met function. (a) RT-PCR showing that the E6I6 MO blocks met mRNA splicing. (b) Activation of Met can initiate intracellular signaling through several different downstream cascades, including MEK1/2 and PI3K [24,25]. This diagram shows the cascade and where specific inhibitors act. See text for details. |
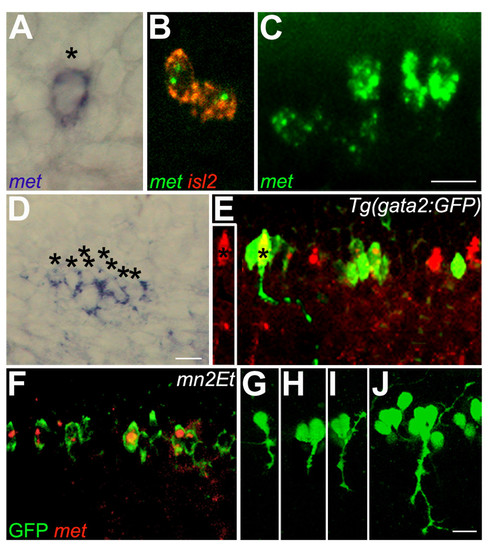
Zebrafish met is expressed in developing spinal motoneurons. All photographs are dorsal to the top and anterior to the left; this is also the case for subsequent figures except where noted. (a) A 22 hpf embryo showing met RNA expression in one cell of a spinal hemisegment (asterisk). (b) A 22 hpf embryo showing co-expression of met (green) and islet2 (red) in CaP and VaP. (c) A 26 hpf embryo showing met expression in all four PMNs in this spinal hemisegment. (d) A 48 hpf embryo showing met expression in eight cells (asterisks) in this hemisegment. (e) A 48 hpf gata2:GFP transgenic embryo showing GFP expression in ventrally projecting SMNs (green) and met expression (red) in a subset of these cells. The axon of the SMN labeled with an asterisk is shown as it projects out of the spinal cord toward its ventral muscle target. The inset to the left shows the same SMN, also marked with an asterisk, in only the red channel, clearly revealing that the SMN expresses met RNA. (f) A 48 hpf mn2Et transgenic embryo showing GFP expression (green) in PMNs and SMNs; met (red) is expressed in a subset of these cells. (g-j) mn2Et transgenic embryos at 24 hpf showing GFP expression in motoneurons: posterior segment showing GFP expression in CaP (g); posterior segment showing GFP expression in CaP and VaP (h); a more anterior segment showing GFP expression in CaP and MiP (i); an even more anterior segment showing GFP expression in CaP, VaP, MiP, RoP and several SMNs (j). Note that even as late as 5 days post-fertilization, in mn2Et embryos GFP-positive cells in the spinal cord all appear to have peripheral axons and no interneuron-like cells express GFP, suggesting that in the mn2Et line GFP is expressed exclusively in motoneurons. Scale bars, 10 μm. EXPRESSION / LABELING:
|
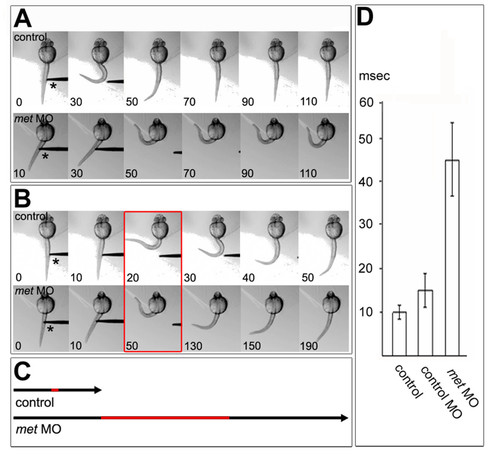
Normal touch-evoked movements require Met function. Embryos are oriented anterior to the top and viewed from dorsal. (a) Control embryo (top panel), head embedded in agarose, responded to touch by bending away from the probe (asterisk); times indicated are milliseconds. A met MO-injected embryo (bottom panel) responded to touch significantly more slowly than the control. Data from the control and met MO-injected embryo are shown on the same time scale. (b) The same embryos as in (a), but for each embryo the entire time-course of the movement is shown. The entire touch response took about 50 ms in the control embryo, but took about 190 ms in the MO-injected embryo, which remained in the coiled position for about 60 ms. Red box indicates maximal bending. (c) Black arrows display the time span of one touch response, as shown in (b), for control and met MO-injected embryos; the red section indicates the time the embryo stayed in a coiled position. (d) Time frame in which control and injected embryos stayed in the coiled position [red in (b,c)]. The differences between control and control MO-injected embryos were not significantly different, but they were both significantly different from met MO-injected embryos (p < 2.6 x 10⁻¹³, n = 46 touch-evoked responses of 8 control embryos and 32 touch-evoked responses of 8 met MO-injected embryos; p < 1.07 x 10⁻⁷, n = 22 touch-evoked responses of 4 control MO-injected embryos and 32 touch-evoked responses of 8 met MO-injected embryos. PHENOTYPE:
|
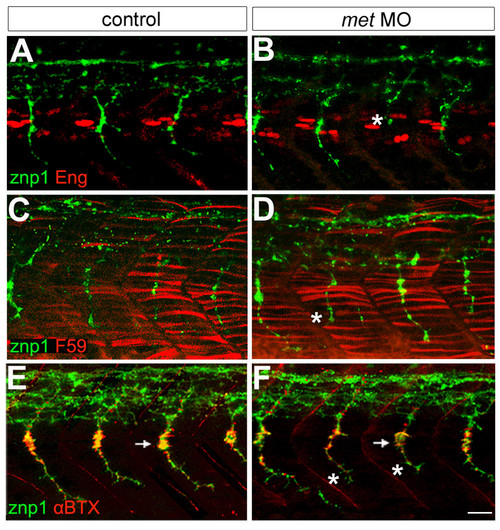
Met appears unnecessary for muscle and neuromuscular junction formation. (a,b) Engrailed antibody (Eng, red) labeling showing muscle pioneer cells and znp1 antibody labeling showing motor axons (green). In met MO-injected embryos, some CaP axons are truncated (asterisk). (c,d) F59 antibody (red) labeling showing fast muscle fibers and znp1 antibody staining showing motor axons (green). F59 labeling appears the same in control (c) and met MO-injected (d) embryos, which have some truncated CaPs (asterisk). (e-f) αBTX (red) labeling showing AChRs and znp1 antibody labeling showing motor axons (green). The distribution of AChRs appears the same in control (e) and met MO-injected embryos (f) that have some truncated CaP axons (asterisks); however, it appears that the number of AChRs may be decreased at the myoseptal varicosity (arrows) by MO injection. For each experiment, 8 spinal hemisegments plus somites were examined in each of 21–33 met MO-injected embryos and 8 spinal hemisegments plus somites in each of 15 controls. Scale bar, 20 μm. |
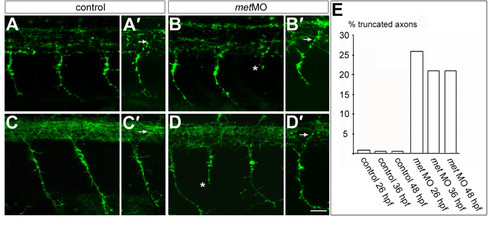
Met is required for normal CaP axons. (a-b′) Embryos at 26 hpf showing PMN axons labeled with znp1 antibody. met MO-injected embryos have normal MiP axons [arrow in (b′)] compared to controls [arrow in (a′)]. However, some CaP axons are truncated in met MO-injected embryos [asterisk in (b)] compared to controls (a). (c-d′) Embryos at 48 hpf showing PMN and SMN axons labeled with znp1 antibody. As at 26 hpf, dorsally projecting axons in met MO-injected embryos appear normal [arrow in (d′)] compared to controls [arrow in (c′)]. However, some ventrally projecting axons are truncated in met MO-injected embryos [asterisk in (d)], compared to controls (c). (e) Average percentage of truncated axons in control and met MO-injected embryos at 26, 36 and 48 hpf. n (26 hpf) = 8 somites in each of 12 embryos; n (36 hpf) = 8 somites in each of 10 embryos; n (48 hpf) = 8 somites in each of 11 embryos. Scale bar, 20 μm. |
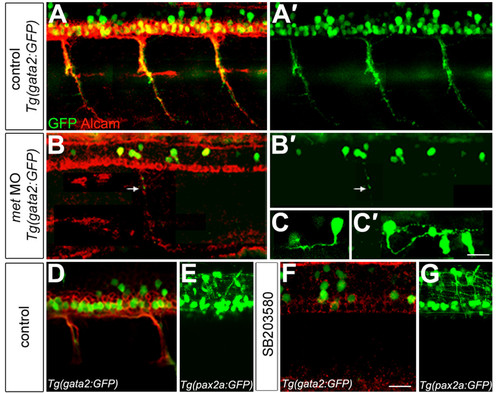
Met is required for secondary motoneuron formation. (a-b′) gata2:GFP (green) transgenic embryos at 48 hpf labeled with antibody to Alcam (red). gata2:GFP is expressed in ventrally projecting SMNs, some of which also express Alcam (a); (a′) shows only the GFP. met MO-injected embryos (b,b′) show a severe decrease in SMNs, but Alcam labeling of the floor plate appears normal. A small number of SMNs form and make ventral projections (arrow). (b) Both markers shown; (b′) only GFP shown. (c,c′). Some of the GFP-positive cells in met MO-injected embryos show interneuron-like axons. (c) An interneuron with an ascending axon; (c′) an interneuron with a descending axon. The two GFP-positive cells to the right in (c′) are SMNs. (d-g) gata2:GFP transgenic embryos (green) at 48 hpf labeled with Alcam antibody (red). Exposure to SB203580 (f) severely decreased the formation of SMNs relative to controls (d), but the overall architecture of the spinal cord appeared normal based on expression of GFP driven by the pax2a promoter (e,g). Scale bar, 20 μm in all panels except (c,c′), which is 10 μm. |
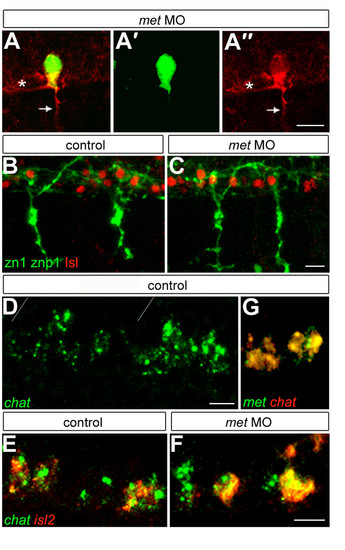
Met is required for aspects of CaP identity. (a) A met MO-injected mn2Et (green) transgenic embryo labeled with znp1 antibody (red) showing that CaP has both a peripheral axon (arrow) and a central axon (asterisk). (a′) The same cell showing only GFP. (a″) The same cell showing only znp1 labeling. (b,c) Islet1/2 antibody (Isl; red) and zn1 plus znp1 antibodies (green) labeling showing that CaPs in met MO-injected embryos (c) co-express these markers as they do in controls (b). For each condition we examined eight spinal hemisegments per embryo. n = 56 met MO-injected embryos and 32 control embryos. (d) chat is expressed in somata in the normal location of PMNs; gray lines show segment boundaries. (e,f) Expression of chat (green) and the CaP and VaP-specific marker islet2 (red) shows that in met MO-injected embryos (f) CaPs express chat, as they do in controls (e). For each condition we examined eight hemisegments per embryo. n = 24 met MO-injected embryos and 15 control embryos. (g) Co-expression of chat (red) and met (green) in PMNs. Scale bars, 10 μm. EXPRESSION / LABELING:
|
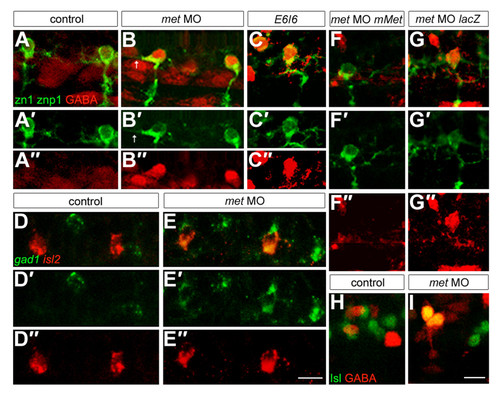
Met is required to prevent CaPs from expressing an inappropriate neurotransmitter. For each condition we examined eight spinal hemisegments per embryo. (a-c″) Embryos at 26 hpf labeled with antibodies to GABA (red) and zn1 plus znp1 (green); (a′,b′,c′) only the green channel is shown; (a″,b″,c″) only the red channel of the micrographs shown in (a,b,c) is shown. CaPs expressed GABA in embryos injected with translation blocking (b-b″) or splice blocking (c-c″) met MOs, but not in controls (a-a″). Note that some CaPs in met MO-injected embryos also have ectopic axons within the spinal cord (arrows). (d-e″) Embryos at 26 hpf labeled with riboprobes to gad1 (green) and islet2 (red). (d′,e′) Only the green channel is shown; (d″,e″) only the red channel of the micrographs shown in (d,e) is shown. In met MO-injected embryos, islet2-positive CaPs also express gad1 (e-e″), whereas these two genes are not co-expressed in CaPs of control embryos (d-d″). (f-g″) Embryos at 26 hpf labeled with antibodies to GABA (red) and zn1 plus znp1 (green). (f′,g′) Only the green channel is shown; (f″,g″) only the red channel of the micrographs shown in (f,g) is shown. CaPs do not express GABA in embryos co-injected with met MO and mMet mRNA (f-f″), but do express GABA in embryos co-injected with met MO and lacZ mRNA (g-g″). (h,i) Embryos at 26 hpf labeled with antibodies to GABA (red) and Islet (green). CaPs co-express Islet and GABA in met MO-injected embryos (i) but not in controls (h). n = 80 embryos in (a); n = 128 embryos in (b); n = 24–32 embryos each for (c,e,f,g); n = 20 embryos for (h); n = 35 embryos for (i). The phenotype was seen in 70% of embryos injected with the splice-inhibitor MO and 80% of embryos injected with translation-blockers; in affected embryos all segments showed the phenotype. Rescue was seen in 90% of embryos injected with mMet mRNA and 0% of embryos injected with lacZ mRNA. Scale bars, 10 μm. |
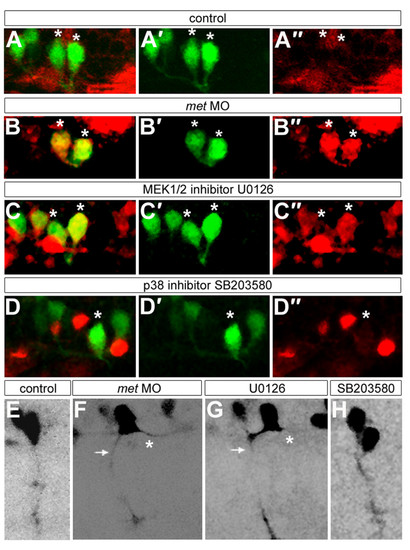
Met signaling may influence CaP axonal and neurotransmitter phenotypes through the MEK1/2 pathway. All panels show mn2Et transgenic embryos. (a-d″) Embryos at 26 hpf showing GFP (green) and GABA (red); asterisks indicate CaPs or CaP/VaP pairs. (a′,b′,c′,d′) Only the green channel is shown; (a″,b″,c″,d″) only the red channel of the micrographs shown in (a,b,c,d) is shown. CaPs express GABA in U0126-treated embryos (c-c″) and met MO-injected embryos (b-b″) but not in controls (a-a″) or in SB203580-treated embryos (d-d″). (e-h) Some CaPs have both peripheral (arrows) and central (asterisks) axons in U0126-treated embryos (g) and met MO-injected embryos (f); CaPs have only have peripheral axons in controls (e) and in SB203580-treated embryos (h). Scale bars, 10 μm. |

Unillustrated author statements |