
- Title
-
Brd4 associates with mitotic chromosomes throughout early zebrafish embryogenesis
- Authors
- Toyama, R., Rebbert, M.L., Dey, A., Ozato, K., and Dawid, I.B.
- Source
- Full text @ Dev. Dyn.
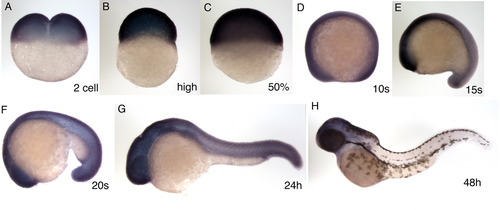
Expression pattern of the zebrafish brd4 gene. A-H: The stage examined by in situ hybridization, carried out as described by Toyama and Dawid ([1997]), is shown in each panel: two-cell stage (A), high stage (B), 50% epiboly (C), 10 somite (D), 15 somite (E), 20 somite (F), 24 hours postfertilization (hpf; G) and 48 hpf (H). D-H: All lateral view, anterior is left. |
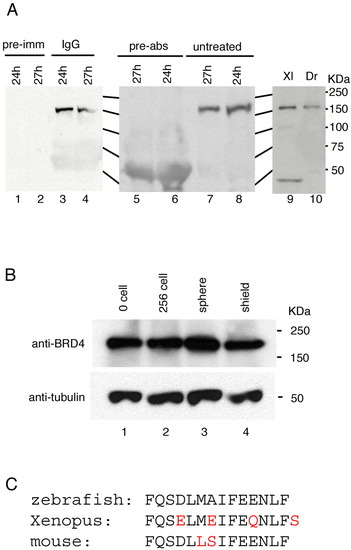
Brd4 protein analysis. A: Antibody characterization. Polyclonal antibody against the Brd4 C-terminal 14 residues detected an approximately 150-kDa protein in zebrafish embryonic extracts (A, lanes 3, 4, 7, 8, and 10). Preimmune serum (pre-imm, lanes 1 and 2) did not detect this protein. Antibody preincubated with antigen peptide (pre-abs, lane 5 and 6) failed to detect the 150-kDa protein. Anti-Brd4 antibody cross-reacts with a protein of predicted size in extracts from Xenopus embryos (lane 9). B: Brd4 protein during zebrafish embryogenesis. Extracts equivalent to two embryos were loaded in each lane. Lower panel shows α-tubulin as a loading control. Stages are indicated for each lane. C: The C-terminal amino acid sequence of zebrafish, Xenopus, and mouse is shown with differences in red. |
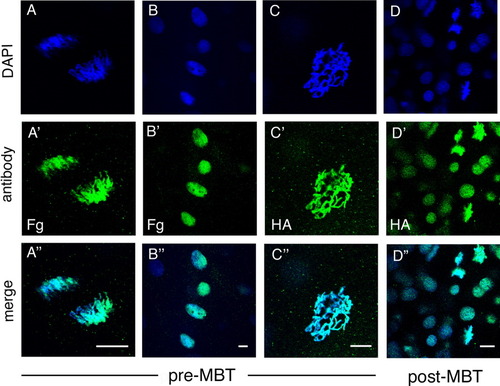
Localization of epitope-tagged Brd4 protein. RNA encoding HA- or FLAG-tagged zebrafish brd4 was injected into one- to two-cell stage embryos and visualized by antibody staining. Each column represents a separate embryo at the stage indicated. A-A″,B-B″: FLAG-Brd4. C-C″,D-D″: HA-Brd4. A-C: Pre-MBT (512 cell stage) embryos with mitotic chromosomes (A, anaphase and C, prophase), and interphase nuclei (B) shown. D: Post-midblastula transition (MBT, sphere to dome stage) embryo presents both mitotic chromosomes and interphase nuclei in one embryo. Scale bar = 10 μm. |
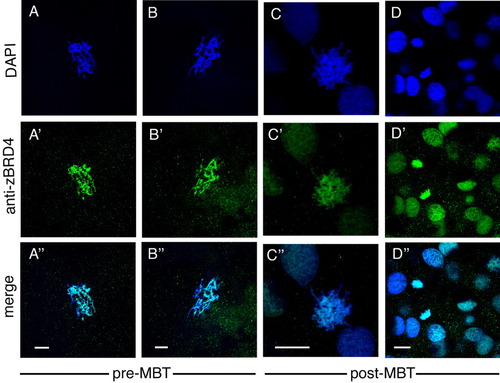
Localization of endogenous Brd4 protein visualized by staining with anti-zebrafish Brd4 antibody. A-A″,B-B″: Pre-midblastula transition (MBT, 256-512 cell stage) embryos. C-C″,D-D″: Post-MBT (sphere to dome stage) zebrafish embryos. A-C: Prophase. Scale bar = 10 μm. |
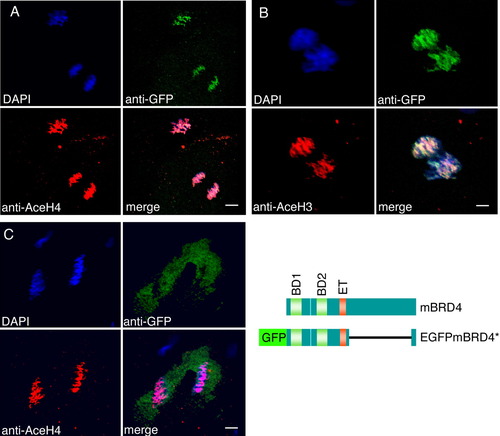
Brd4 protein is colocalized with acetylated histones in zebrafish embryos. A-C: Enhanced green fluorescent protein (EGFP) -mBrd4* RNA lacking amino acids 700-1317 was injected into one- to two-cell embryos (A,B); EGFP RNA was injected as control in (C). The embryos were fixed before midblastula transition (MBT) at 256-cell (A,C) and 128- to 256-cell stage (B), and immunostained with anti-acetyl-histone antibodies (red) and anti-GFP antibodies (green). A: Anti-tetra-acetyl-histone H4; (B) anti-di-acetyl-histone H3; (C) anti-tetra-acetyl-histone H4. The structures of wild type and fusion brd4 constructs are shown. Scale bar = 8 μm in A,C; 4 μm in B. |
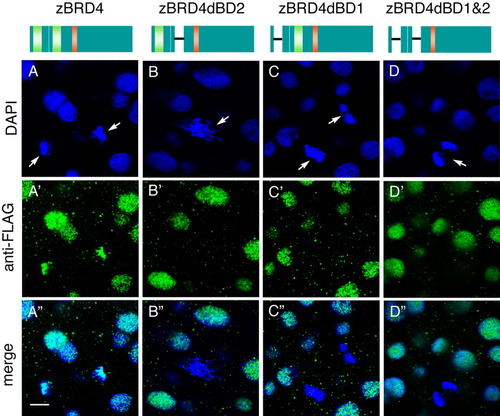
Bromodomain-deleted zebrafish Brd4 proteins do not associate with mitotic chromosomes. Constructs are shown schematically at the top: Brd4, FLAG-tagged construct containing both bromodomains; constructs with deletions of bromodomain 1 (dBD1), bromodomain 2 (dBD2), or both bromodomains (dBD1 and 2). RNAs were injected into one- to two-cell stage zebrafish embryos, and stained at the sphere stage with anti-FLAG antibody (green). Arrows indicate mitotic chromosomes. Scale bar = 10 μm. |
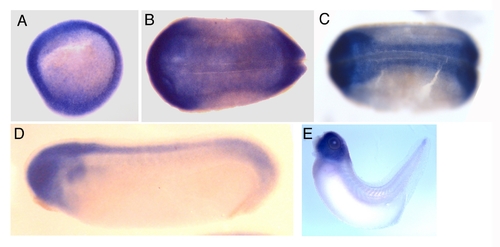
Expression pattern of the Xenopus brd4 B gene. A, gastrula at stage 10.5, animal pole view; B, st 14; C, st 17; D, st 23; E, st 37. (B-E) lateral view, anterior is left. |
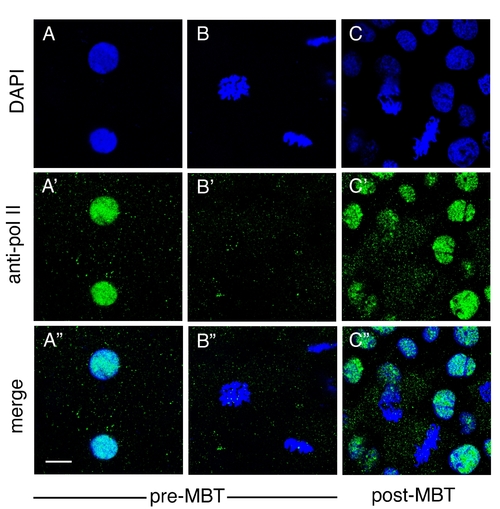
RNA polymerase II does not associate with mitotic chromosomes in pre-MBT or post-MBT embryos. Zebrafish embryos were fixed at the 256 cell and sphere stages. Mouse monoclonal anti-RNA polymerase II antibody (8WG16) was obtained from Covance. (A-A″ and B-B″) pre-MBT (256 cell), (C-C″) post-MBT (sphere). (A-C) DAPI staining, (A′-C′) anti-RNA polymerase II, (A″-C″) merged image. (A-A″) Interphase nuclei, (B-B″) mitotic chromosomes. Scale bar: 10 μm. |