
- Title
-
Identification and characterization of a novel gene differentially expressed in zebrafish cross-subfamily cloned embryos
- Authors
- Pei, D.S., Sun, Y.H., Chen, C.H., Chen, S.P., Wang, Y.P., Hu, W., and Zhu, Z.Y.
- Source
- Full text @ BMC Dev. Biol.
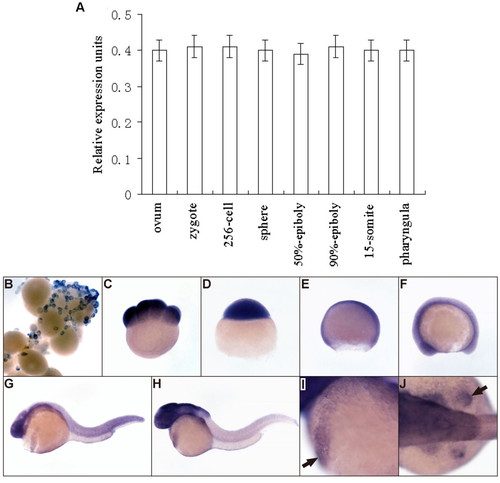
Analysis of the expression level of K31 gene at different developmental stages in zebrafish. (A) Real time RT-PCR analysis of K31 transcription during development. K31 transcripts are expressed maternally in the ovum. From zygote to pharyngula period, K31 has a characteristic of constitutive expression gene. GAPDH was used as endogenous reference. (B-J) Expression of K31 transcripts as detected by WISH during embryogenesis in zebrafish. (B) ovary, (C) 8-cell stage (1.25 hpf, hours post-fertilization), (D) sphere stage (4 hpf), (E) 75% epiboly (8 hpf), (F) 10-somite stage (13 hpf), (G) 1 dpf (day post-fertilization), (F) 2 dpf, (I) 2 dpf embryo with arrow indicating the hatching gland, (J) 2 dpf embryo with arrow indicating the pectoral fin. Embryos in C-I are lateral views, C-E with the animal pole to the top, and the dorsal to the right, F-I with dorsal to the top and anterior to the left; embryo in J is dorsal view, with anterior to the left. |
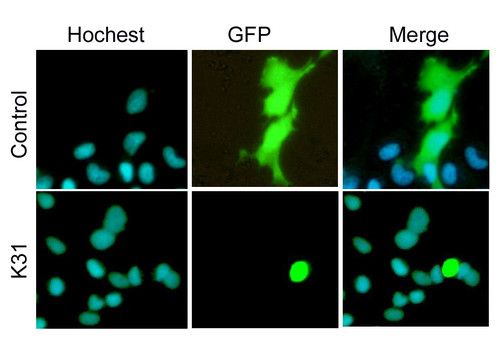
Sub-cellular localization of pEGFP-K31 expressed in EPC cells. The sub-cellular localization of control (pEGFP-N3) and pEGFP-K31 expressed GFP signals in EPC cells was in the upper and lower rows, respectively. Therein, blue signals represented the cell nuclei stained by Hochest 33342; Green signals represented the expression of pEGFP-N3 and pEGFP-K31 fluorescence proteins in EPC cells, respectively; Merge represented overlapping the images of pEGFP-N3 or pEGFP-K31 fluorescent protein with the images of cell nuclei stained by Hochest 33342. All three panels had the same view field at 24 h after transfection. |
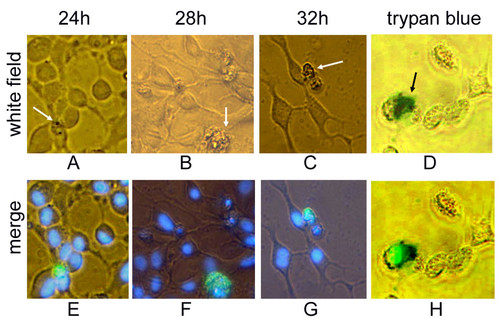
Ectopic over-expression of K31 protein at different times after transfection. (A-C) the shapes of EPC cells taken in white field at 24 h, 28 h and 32 h after transfection by pEGFP-K31, respectively. The white arrows indicate the supposed dying cells. (E-G) the overlaps of the EGFP fluorescence and the cell nuclei stained by Hochest 33342 for A-C, respectively. (D, H) confirmation of the supposed dying cells using trypan blue dye; D is the shapes of EPC cells taken in white field at 32 h after transfection and stained by trypan blue; The black arrow indicate the dead cell. H is the overlaps of the EGFP fluorescence and the dead cell stained by trypan blue. Green, blue and dark blue signals represented GFP fluorescence, Hochest 33342 stained nuclei and trypan blue stained dead cell, respectively. |