
- Title
-
The zebrafish mutant lbk/vam6 resembles human multi-systemic disorders caused by aberrant trafficking of endosomal vesicles
- Authors
- Schonthaler, H.B., Fleisch, V.C., Biehlmaier, O., Makhankov, Y., Rinner, O., Bahadori, R., Geisler, R., Schwarz, H., Neuhauss, S.C., and Dahm, R.
- Source
- Full text @ Development
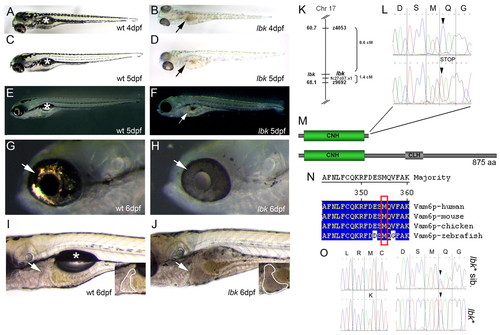
A mutation in vam6 causes hypopigmentation and hepatomegaly in lbk. (A-D) Bright-field images show the hypopigmentation of skin melanocytes and the RPE, and a brownish discolouration of the intestinal tract (B,D, arrows) in lbk. Asterisks in A,C indicate the swim bladders in wild-type larva. (E-H) Dark-field images show an absence of iridophore reflections in the lbk skin and eye (G,H; arrows). Note the translucency of the lbk RPE in H. Arrow in F indicates the intestinal tract. Asterisk in E indicates the lac of swim bladder. (I,J) lbk larvae display an enlarged liver (insets in I,J; outlined areas) and lack swim bladders (asterisk). (K-O) The gene for Vam6p is mutated in lbk. (K) Genetic mapping of lbk resulted in linkage to SSLP markers z9692 and z4053 on chromosome 17. RH mapping of zebrafish vam6 resulted in linkage to EST fc27c07.x1, which was found to be located close to z9692 on the T51 RH map and thus served as an anchor to link the two maps. (L) Sequencing of cDNA from lbk-/- and homozygous wild-type larvae revealed a nucleotide exchange at position 1066 from C→T (arrowheads), resulting in a premature STOP codon. (M) Domain structures of the wild-type Vam6p (bottom) and the protein truncated in lbk lacking the C-terminal 520 amino acids (top), including the clathrin homology (CLH) repeat domain and Ypt7p-interacting sequences. (N) Sequence alignment of human, mouse, chicken and zebrafish Vam6p proteins shows the high level of conservation in the region affected by the mutation (red box). (O) Sequencing of the complete vam6 cds from the lbk* mutant revealed that this larva was heterozygous at two positions: the C→T nucleotide exchange identified in lbk (right panel, lower trace; arrowhead) and a novel T→A exchange at position 374 of the vam6 cds (left panel, lower trace). The latter results in the exchange of a conserved methionine (M) at amino acid position 125 for a lysine (K) in the N-terminal citron homology (CNH) domain (see Figs S2, S3 in the supplementary material). Sequencing of the complete vam6 cds from lbk* siblings showed the heterozygous presence of the lbk mutation (right panel, upper trace; arrowhead), but the absence of the T→A exchange at position 374 (left panel, upper trace). |
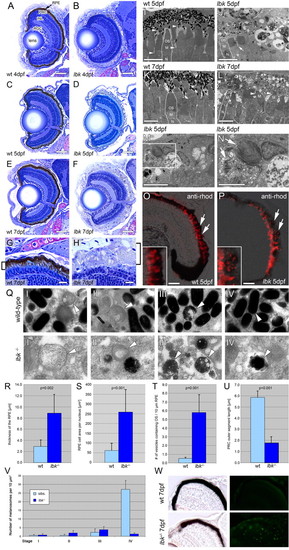
lbk larvae display a severely compromised RPE and shorter PRC outer segments. (A-H) Sections of lbk (B,D,F,H) and sibling (A,C,E,G) eyes show that overall eye development proceeds normally in lbk, including the formation of a multi-layered neural retina. Beginning at 4 dpf (A,D), however, the retinal pigment epithelium (RPE) is severely hypopigmented and becomes progressively inflated. At 7 dpf (E-H), the RPE in lbk is threefold thicker than in age-matched siblings (G,H; brackets). The inner retina in lbk is morphologically indistinguishable from wild-type siblings. INL, inner nuclear layer; PRC, photoreceptor cells; RGC, retinal ganglion cells. (I-N) TEM sections reveal that the lbk RPE contains very few mature melanosomes. The majority of melanosomes are aberrantly shaped and show regions that lack pigment. Moreover, the mutant RPE is filled with numerous vesicles. The number of vesicles increases from 5-7 dpf (compare J with L). The microvilli of the RPE (I, arrowheads) that normally interdigitate with the outer segments of PRCs are significantly reduced in lbk (J; arrow). Furthermore, the outer segment length is reduced. Some lbk PRCs virtually lack outer segments (L, arrowheads). (M,N) Higher magnification of vesicles containing undigested PRC outer segments (arrows) in the lbk RPE (N shows a higher magnification of the boxed area in M). M, PRC mitochondria; N, PRC nucleus; OS, PRC outer segment. (O,P) Merged phase contrast and fluorescence images of eye sections stained for rhodopsin (red) show an increase of discrete rhodopsin-positive vesicles in the lbk RPE (P, arrows) versus continuous PRC OS in the wild type (O, arrows). Insets show higher magnifications of parts of the RPE from the sibling and mutant retinas shown in O and P. (Q) Images showing melanosomes at different stages of maturation (I-IV) in the sibling (top) and lbk (bottom) RPE at 5 dpf. Arrowheads indicate melanosomes of the respective stages. (R-U) Statistical analyses of RPE thickness (R), average RPE cell area per nucleus (S), average number of vesicles containing PRC outer segments (T) and PRC outer segment length (U) in sibling and lbk larvae at 5 dpf. Error bars indicate standard deviations; P values were calculated using Student′s t-test. (V) Quantification of melanosomes at different stages of maturation in the lbk and sibling RPE at 5 dpf. Counts represent the numbers of melanosomes in areas of 10 µm2. Although there are no substantial differences between the numbers of stage I-III melanosomes, mutant larvae contain significantly fewer mature (stage IV) melanosomes. (W) TUNEL labelling of cryosections shows increased levels of apoptosis in lbk (bottom right). The relatively dark appearance of the mutant RPE results from the thickness of these sections (40 μm). All images were derived from mid-transversal sections of the eye. Scale bars: 50 μm in A-F; 10 μm in G,H; 5 μm in I-M; 2.5 μm in N; 25 μm in O,P. |
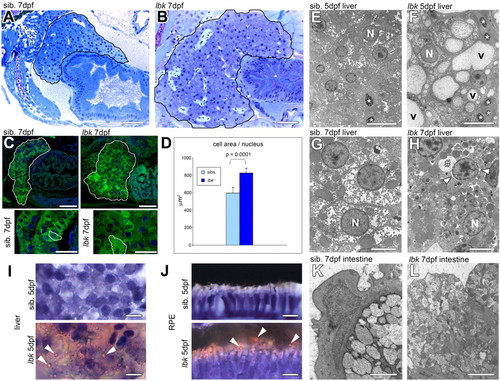
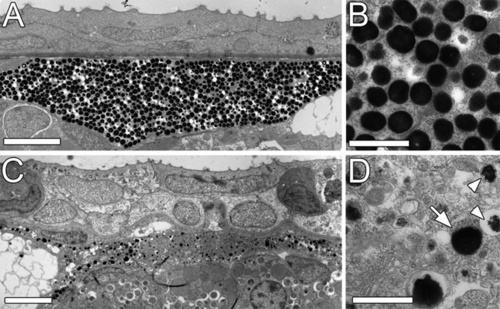
lbk larvae display vesicular phenotypes in liver and intestinal cells. (A,B) Longitudinal sections showing the liver and part of the intestine. There is a substantial increase in liver size (outlined) in lbk. Sections were derived from the same region of the body and images are reproduced at the same magnification. (C) Confocal LSM images of larvae expressing GFP under the intestinal promoter ef1 reveal an increase in liver size (top row, outlined) in lbk. Nuclei are stained with DAPI (blue). Bottom row shows higher magnifications of regions from livers shown in the top row. Individual liver cells are outlined showing the increase in hepatocyte size in lbk. The arrangement of hepatocytes in lbk is disorganised. (D) Quantification of the average cell area per nucleus in histological sections of livers revealed that the lbk liver shows on average an area 30% larger than that of age-matched siblings [n=5 (sibs.), n=7 (lbk); P=0.0001]. (E-H) Transverse TEM sections of livers show that lbk hepatocytes contain numerous large vesicles (v). Asterisks indicate erythrocytes. At 7 dpf, lbk hepatocytes display necrotic changes: e.g. a condensation of nuclear chromatin; an increase in the space between the nuclear membranes (arrowheads); a massively inflated ER lumen (#), which is continuous with the nuclear membranes; and numerous vesicles often displaying an electron-dense lumen. N, nucleus. (I,J) Oil Red O staining of the liver (I) and RPE (J) reveals lipid-containing vesicles (arrowheads) in hepatocytes and the RPE in lbk. (K,L) Transverse TEM sections of the anterior intestine show an increase in number and decrease in size of vesicles in the cells lining the intestine in lbk. Scale bars: 50 μm in A,B; 50 μm in C; 25 μm in insets; 10 μm in E,F,I,J; 5 μm in G,H; 2 μm in K,L. |
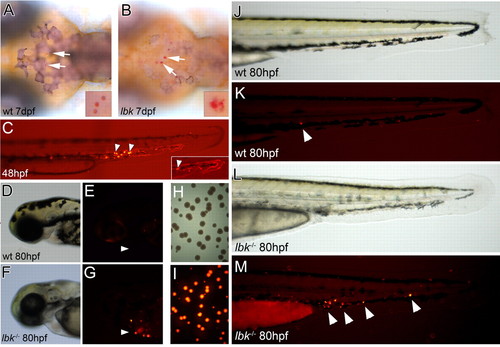
lbk larvae show a compromised ability to clear bacterial infections. (A,B) Dorsal views of larvae in which macrophages were stained with Neutral Red to reveal intracellular vesicles (arrows). Compared with the vesicles observed in wild-type macrophages, those in lbk appear enlarged, heterogeneous in size and less regularly shaped. Insets show higher magnifications of macrophage vesicles. (C) Combined bright-field and fluorescence images of the tail of a 48 hpf larva 5 minutes after the injection of DsRed-fluorescent bacteria, showing bacteria still circulating in the bloodstream (inset; fluorescent traces of bacteria moving in blood vessels) and bacteria that have been engulfed by phagocytes (arrowheads). (D-G) Head regions of sibling and lbk larvae 32 hours after bacteria injection. Fluorescent bacteria-laden phagocytes are present in lbk (arrowheads). (H,I) Bright-field (H) and fluorescence images (I) of a bacterial plate showing bacterial colonies from an lbk larva macerated at 85 hpf, 37 hours after Salmonella injection. (J-M) Tails of sibling and lbk larvae 32 hours after bacteria injection. Arrowheads indicate fluorescent bacteria-containing phagocytes. PHENOTYPE:
|
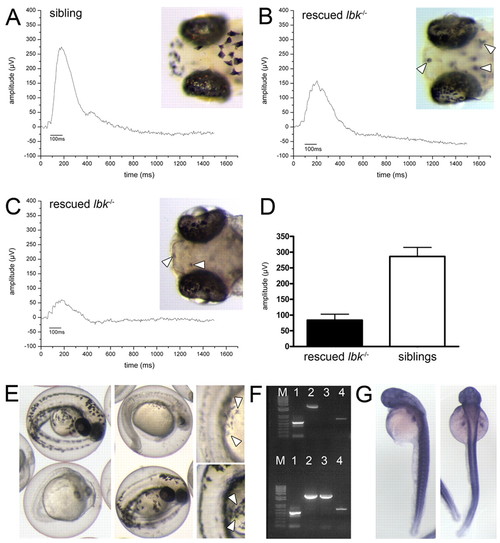
The lbk phenotype can be partially rescued by the expression of vam6 in lbk-/- larvae and phenocopied by vam6 knock-down. (A-C) Electroretinogram analyses of 5 dpf vam6 vector-injected and heat-shocked sibling (A) and lbk-/- (B,C) larvae. In contrast to uninjected lbk larvae (Fig. 3B), injected lbk larvae displayed significant b-waves, indicating partial rescue of retinal function. The b-wave amplitude varied between different lbk larvae with some showing up to 60% of the wild-type b-wave amplitude (B), while others reach only ∼20% (C). Insets show head regions of vam6 vector-injected sibling (A) and lbk larvae (B,C) and the extent of rescue in RPE and skin melanocyte pigmentation. Arrowheads indicate skin melanocytes with near wild-type levels of melanin in rescued larvae. (D) Quantification of the observed ERG rescue: sibling larvae display an average b-wave amplitude of 286 μV, vam6 vector-injected lbk larvae show an average b-wave amplitude of 83 μV (n=7 for both sets of larvae; error bars show standard deviations). (E) Phenotype of the vam6 knock-down at 36 hpf showing the hypopigmentation of the RPE and skin melanocytes (insets; arrowheads) characteristic of lbk. However, the knock-down results in additional phenotypes not observed in lbk, including a small head and eyes and a shortened body axis. Larvae displaying wild-type levels of melanin are age-matched control morpholino-injected individuals. (F) PCR analysis for the presence of vam6 transcripts in RNA isolated from wild-type zebrafish zygotes (upper half of gel) and 24 hpf embryos (lower half). β-Actin (expressed at all developmental stages) and pmel17 [onset of expression: ∼20 hpf (Schonthaler et al., 2005)] served as controls. Lane M, 100 bp ladder; lane 1, amplification of a 530 bp β-actin cDNA fragment; lanes 2 and 4, amplification of two different fragments of the zebrafish vam6 cDNA (2628 bp and 707 bp) with independent primer pairs; lane 3, amplification of a 2538 bp fragment of the pmel17 cDNA. (G) Whole-mount in situ hybridisation on PTU-treated 48 hpf wild-type embryos (left, lateral view; right, dorsal view) showing vam6 expression. |
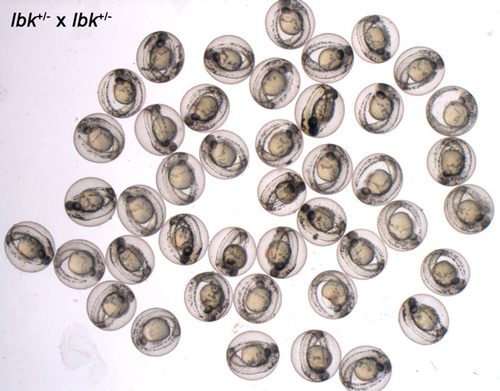
External phenotype of lbk mutant and sibling embryos at 48 hours of development. Clutch of embryos from a pair of lbk+/- heterozygous zebrafish at 2 dpf. Although some embryos display lower levels of melanin pigmentation in skin melanocytes and in the RPE, the differences are gradual and allow no reliable distinction between wild-type and lbk-/- mutant individuals at this stage. PHENOTYPE:
|
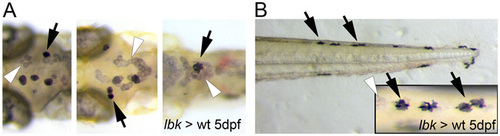
Transplantation experiments show that the defect in lbk is cell-autonomous. Bright-field images of the dorsal head region (A) and tail (B) of four dark-adapted 5 dpf larvae. The skin melanocytes that have developed into normally pigmented melanocytes in an lbk-/- mutant background (arrows). Inset in B is a higher magnification dorsal view of four melanocytes with wild-type appearance indicated by arrows in B. Melanocytes displaying the severe hypopigmentation characteristic of lbk (white arrowheads) can be seen next to cells showing wild-type levels of melanin (black arrows). |
Skin melanocytes are hypopigmented in lbk. Skin melanocytes in wild-type (A,B) and lbk mutant larvae (C,D) at 5 dpf. (B,D) Higher magnifications of regions in A and C, respectively. Melanosome number is substantially reduced in the lbk melanocytes (C), which leads to the hypopigmentation characteristic of these mutants, and the abnormally shaped melanosomes (D, arrowheads). Despite a majority of abnormally small and misshapen melanosomes, lbk skin melanocytes contain some melanosomes displaying wild-type size, shape and levels of melanin pigmentation (arrow). Scale bars: 5 μm in A,C; 1 μm in B,D. PHENOTYPE:
|
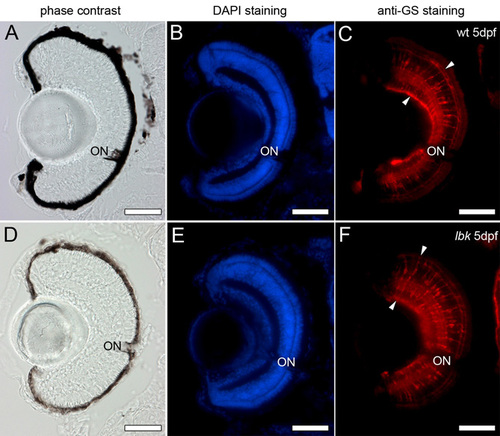
Retinal Müller glia cells show a normal morphology in lbk mutants. Cryosections of 5 dpf wild-type and lbk eyes were stained with DAPI (blue; panels B and E) to show the position of the nuclei in the retina and an antibody against the glia-specific enzyme glutamine synthetase to label the retinal Müller glia cells (red; arrowheads in C and F). Phase-contrast images of the sections of wild-type and lbk eyes are shown in A and D, respectively. No obvious differences in the number, arrangement and morphology of the Müller glia cells were observed between wild-type and lbk larvae. ON, optic nerve. Scale bars: 50 μm. PHENOTYPE:
|
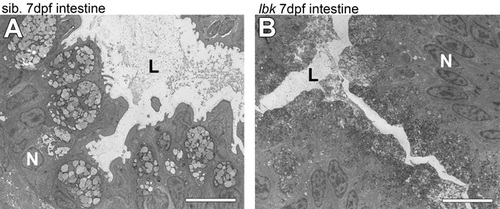
The intestine of lbk mutant larvae shows an increase in small vesicles. Transversal TEM sections of the anterior intestine of 7 dpf wild-type (A) and lbk mutant (B) larvae show an increase in the number and decrease in the size of vesicles in the cells lining the intestinal lumen in lbk. The images are overviews comprising the higher magnifications shown in Fig. 4K,L, respectively. L, intestinal lumen; N, nucleus. Scale bars: 10 μm in A,B. PHENOTYPE:
|
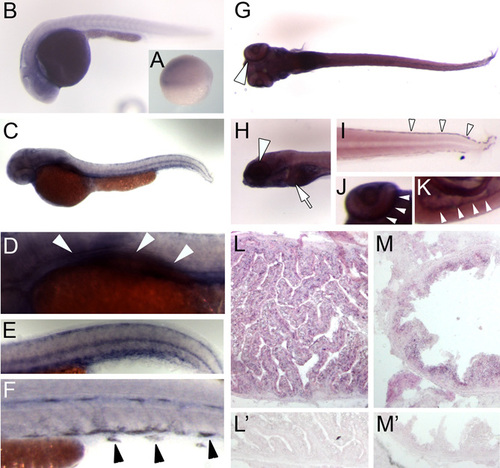
vam6 mRNA is widely expressed during zebrafish development. Whole-mount in situ hybridisation detecting vam6 mRNA expression at different stages of development (A-K) and in adult tissues (L,M) of wild-type zebrafish. (A) Shield stage embryo (6 hpf); vam6 mRNA expression is comparatively weak in all cells of this stage. (B) 24 hpf embryo; at this stage vam6 is widely expressed with the highest levels in the developing brain. (C-F) 48 hpf embryo; vam6 expression has increased compared with earlier stages. Expression is highest in the head region, the region of the developing liver and intestinal tract (D; arrowheads) and in the skin melanocytes (E,F; arrowheads). (G-K) 5 dpf larva; ventral views (G,J) and lateral views (H,I,K). As in earlier stages, vam6 mRNA is widely expressed, but at higher levels than before. Strong expression can be detected in the peripheral retina (region of the RPE; arrowheads in G, H and J), the liver (H; arrow), the melanocytes of the skin (I; arrowheads) and the intestinal tract (K; arrowheads). (L,L′) Expression of vam6 mRNA in the adult zebrafish liver. Panel L′ shows the corresponding sense probe. (M,M′) vam6 mRNA expression in the cells lining the intestinal tract in the adult zebrafish. M′ shows the corresponding sense probe. |