
- Title
-
Combined activity of the two Gli2 genes of zebrafish play a major role in Hedgehog signaling during zebrafish neurodevelopment
- Authors
- Ke, Z., Kondrichin, I., Gong, Z., and Korzh, V.
- Source
- Full text @ Mol. Cell Neurosci.
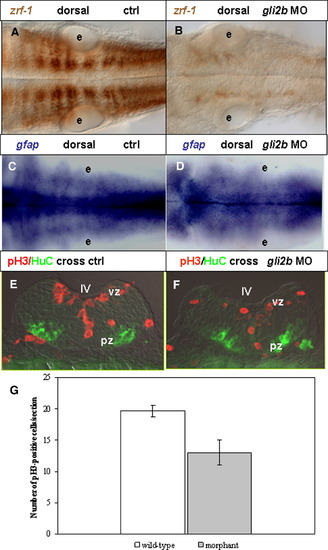
Gli2b and cell proliferation in the hindbrain. (A, B) zrf-1 stained radial glial cells in the hindbrain in 30 hpf control (A) and Gli2b morphant (B), dorsal view. (C, D) Expression of gfap in control (C) Gli2b morphant (D). (E, F) Cross sections of 30 hpf control (E) and Gli2b morphant (F) at the posterior hindbrain level stained by anti-P-H3 (red) and HuC (green) antibody. (G) A graph based on Table 1 that demonstrates changes in a number of proliferating cells in Gli2b morphants comparing to controls. Abbreviations: e, ear; pz, pial zone; vz, ventricular zone. |
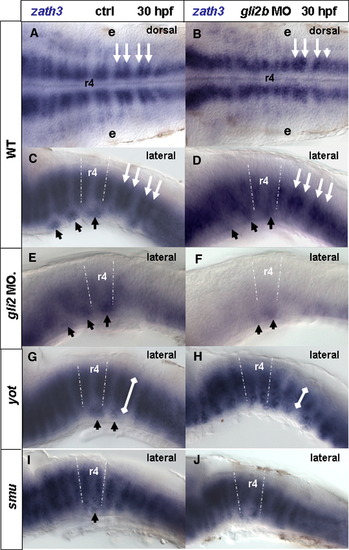
Gli2a and Gli2b regulate expression of zath3. zath3 expression in the hindbrain in 30 hpf in control (A, C, E, G, I) or gli2b morphants (B, D, F, H, J). White broken lines indicate rhombomere 4 (r4). (A, C) Control; (B, D) Gli2b morphant; (E) Gli2a morphant; (F) Gli2a/Gli2b morphant; (G) yot-/- mutant; (H) yot-/- mutant/Gli2b morphant; (I) smu-/- mutant; (J) smu-/- mutant/Gli2b morphant. Black arrows indicate ventral zath3-positive clusters of the hindbrain. White arrows (A–D) indicate D–V clusters. White lines (G, H) illustrate the D-V extent of the cluster. Abbreviations: e, ear; r4, rhombomere 4. EXPRESSION / LABELING:
|
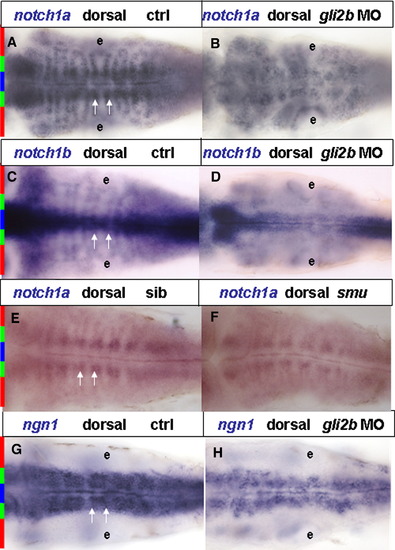
Expression of early neurodifferentiation markers in the hindbrain of Gli2b morphant. (A, B) notch1a in Gli2b morphant (A) and control (B). (C, D) notch1b in Gli2b morphant (C) and control (D). (E, F) notch1a in a sibling (E) and smu mutant (F). (G, H) ngn1 in Gli2b morphant (G) and control (H). White arrows that indicate distance between medio-lateral clusters (A, E) encompass the whole domain of ngn1 expression (G). The relative positions of expression domains are indicated in left side of the panel: midline, blue bar; intermediate medio-lateral cluster, green bar; lateral loops; red bar. Abbreviations: e, ear. EXPRESSION / LABELING:
|
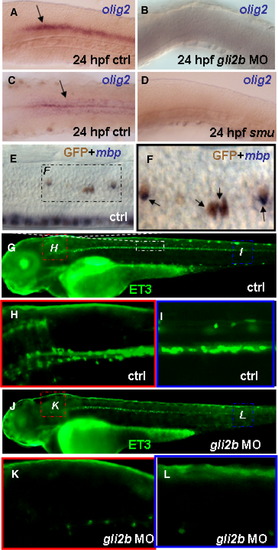
Gli2b and Olig2. olig2 expression in the hindbrain in 24 hpf control embryo in lateral view (A, black arrow), 24 hpf Gli2b morphant in lateral view (B), 24 hpf control embryo in dorsal view (C, black arrow) and 24 hpf smu mutant in lateral view (D). In the ET3 line GFP maps oligodendrocytes as shown by double staining of anti-GFP antibody and antisense mbp probes (E). Blow-up (F) of the black frame in panel E reveals the mbp mRNA (blue, arrows) in GFP expressing cells (brown). (G) 4 dpf control ET3 line and ET3 Gli2b morphants (J). Blow-up of the hindbrain (H) and posterior trunk (I) in 4 dpf ET3 controls. Blow-up of the hindbrain (K) and posterior trunk (L) in ET3-Gli2b morphant. |
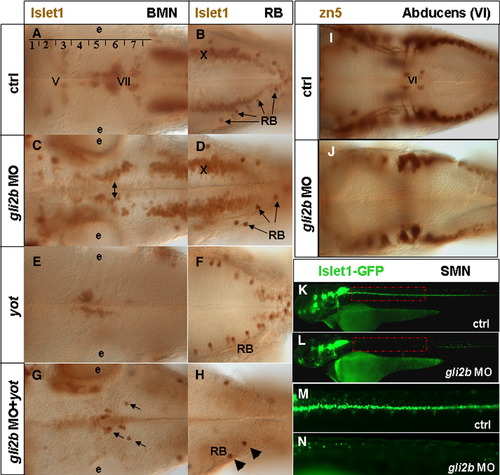
Gli2/Gli2b and cell differentiation. (A) Islet1-positive branchiomotor neurons (BMNs) and (B) RBs in 48 hpf wild-type embryos. Rhombomeres are numbered in Arabic. The motor nuclei of cranial nerves numbers are in Roman as follows: V, trigeminal; VI, abducens; VII, facial; X, vagal. (C) In Gli2b morphants the motor nuclei (in particular, the facial one, two-headed arrow) were further away from the ventral midline. (D) In Gli2b morphants the RBs were slightly reduced. (E) BMNs and (F) RBs in yot-/- mutant. The trigeminal and vagal motor nuclei are absent. Cell migration of the facial nucleus from rhombomere 4 to rhombomeres 6, 7 is affected (E). No major change in distribution of RBs was found in yot-/-. (G) The residual cells of facial nucleus of yot-/- were reduced even further after injection of gli2b MO while some that remain (arrows) migrated to rhombomeres 6, 7, and the number of RBs (arrowheads) was largely reduced (H). (I) The abducens nucleus (VI) labeled with zn5 antibody in 48 hpf wild-type embryos. These cells were lost in Gli2b morphants (J). (K, L) Position-related changes of motor neurons in controls (K) and Gli2b morphants (L). (M, N) Blow-up of the mid-trunk region indicated by the red line in panels K and L. Abbreviations: e, ear. |
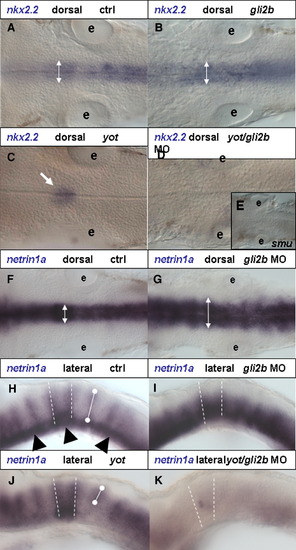
Gli2b and r4. nkx2.2 expression in the hindbrain in 30 hpf, dorsal view. (A) control, (B) Gli2b morphant. nkx2.2 expression domain was slightly expanded in Gli2b morphant (two-headed arrow). (C) yot-/- mutant. (D) yot-/-/Gli2b morphant without nkx2.2 expression in the hindbrain (black arrow). This phenotype is similar to that in smu-/- (E). (F) Dorsal and (H) lateral view of netrin1a expression in the hindbrain of 30 hpf controls and Gli2b morphants (G, I). In Gli2b morphants netrin1a expression in the ventral hindbrain domain was up-regulated and expanded laterally. (J) In yot-/-, netrin1a expression was affected ventrally, but unaffected dorsally. After injection of Gli2b MO into yot-/- only a trace of expression was detected in the r4 (black arrow, F). Black arrowhead in panel H—floor plate expression domain; white bullet line in panels H and J defines D-V extent of expression domain. Abbreviations: e, ear. |
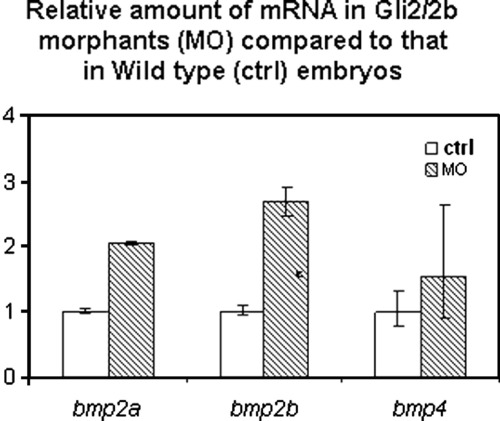
Gli2 and Gli2b regulate expression of bmp2a/2b. Total RNA was extracted from 50 Gli2/2b morphants or wild-type embryos. RT-PCR was carried out in triplicate for each sample. The whole experiment was repeated twice. EXPRESSION / LABELING:
|
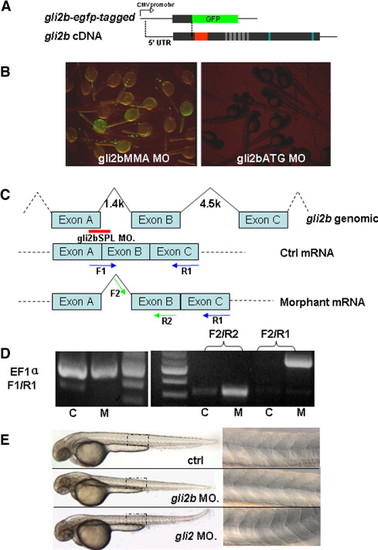
The design and verification of efficiency of anti-Gli2b morpholino. (A) egfp-tagged gli2b construct was made by fusing the fragment containing 5′-untranslated region of gli2b and adjacent region coding the partial N-terminal of Gli2b with egfp coding region. (B) Embryos injected with egfp-tagged gli2b and 4 bp mis-matched control morpholino (gli2bMMA) expressed GFP (left). Embryos co-injected by egfp-tagged gli2b and antisense morpholino (gli2bATG) did not express GFP (right). (C) The diagram shows the strategy of using splicing MO (Red line) for blocking the normal splicing site and organization of predicted mRNA. The blue and green arrows represent the primers for PCR used to evaluate effect of the splicing MO on posttranscriptional processing of gli2b mRNA. (D) RT-PCR using control mRNA (lane C) extracted from gli2bMMS morphants with primers F1/R1 resulted in a band, in contrast to mRNA extracted from gli2bSPL morphant (lane M). However, there were products generated by RT-PCR using morphant gli2bSPL mRNA and prcontrol mRNA (lane C) extracted from gli2bMMS morphants with primers F1/R1 resulted in a band, in contrast to mRNA extracted from gli2bSPL moimers F2/R2 and F2/R1, indicating the successful blocking of proper splicing of exon A and exon B in Gli2b morphants. EF1α primers were used as internal control. (E) Top to bottom: the control morpholino injected embryo, Gli2b morphant, Gli2 morphant. A panel on the right hand side shows the mid-trunk somites at high magnification. The egfp-tagged gli2b-expressing construct was made to test the activity of gli2bATG MO (Fig. S1A). The GFP fluorescence was detected in control morphants after injection of egfp-tagged gli2b construct and 4-bp mis-matched control MO (gli2bMMA). The fluorescence was absent after injection of gli2bATG MO (Fig. S1B). The gli2bSPL MO targets the boundary region of the exon A and adjacent intron (Fig. 1C). When RNA was extracted from gli2bSPL morphants, RT-PCR amplified the fragment predicted for improperly spliced gli2b mRNA (Figs. 1C, D). The fragment corresponding to the normal mRNA (Fig. 1C) was not amplified (Fig. 1D), illustrating high efficiency of MO-mediated mis-splicing of gli2b mRNA. PHENOTYPE:
|
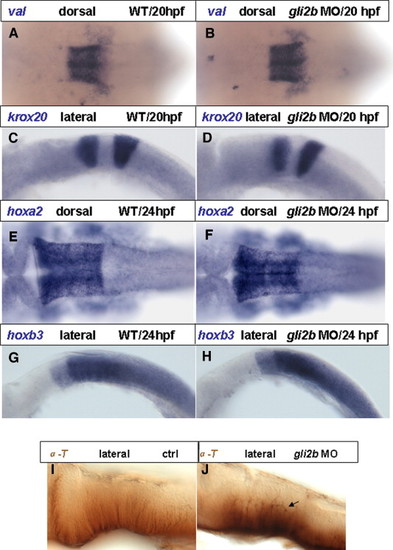
Expression of segmentation markers in Gli2b morphants. (A, B) Expression of val in r5 and r6 in controls (A) and Gli2b morphants. (C, D) Expression of krox20 in r3 and r5 in controls (C) and Gli2b morphants (D). (E, F) Expression of hoxa2 in r2–r5 in controls (E) and Gli2b morphants (F). (G, H) Expression of hoxb3 in r5–7 in controls (G) and Gli2b morphants (H). (I, J) Immunohistochemical staining with anti-acetyl-tubulin antibody in controls (I) and Gli2b morphants (J). EXPRESSION / LABELING:
PHENOTYPE:
|

Unillustrated author statements |
Reprinted from Molecular and cellular neurosciences, 37(2), Ke, Z., Kondrichin, I., Gong, Z., and Korzh, V., Combined activity of the two Gli2 genes of zebrafish play a major role in Hedgehog signaling during zebrafish neurodevelopment, 388-401, Copyright (2008) with permission from Elsevier. Full text @ Mol. Cell Neurosci.