
- Title
-
Transcriptional profiling reveals barcode-like toxicogenomic responses in the zebrafish embryo
- Authors
- Yang, L., Kemadjou, J.R., Zinsmeister, C., Legradi, J., Bauer, M., Muller, F., Pankratz, M., Jakel, J., and Straehle, U.
- Source
- Full text @ Genome Biol.
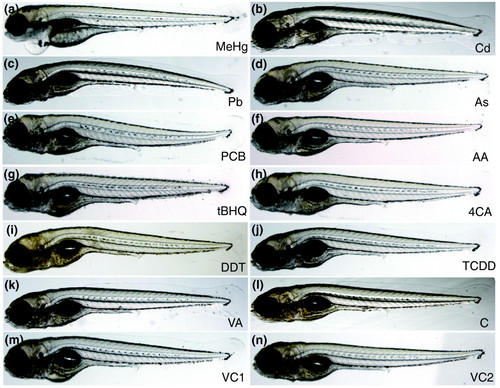
Toxicants induce similar morphological changes in 120 hpf zebrafish embryos. Embryos were treated with (a) methylmercury chloride (60 μg/l, MeHg); (b) CdCl2 (5 mg/l, Cd); (c) PbCl2 (2.8 mg/l, Pb); (d) As2O3 (79 mg/l, As); (e) Aroclor 1254 (33 mg/l, PCB); (f) acrylamide (71 mg/l, AA); (g) tert-butylhydroquinone (1.7 mg/l, tBHQ); (h) 4-chloroaniline (50 mg/l, 4CA); (i) 1,1-bis-(4-chlorophenyl)2,2,2-trichloroethane (15 mg/l, DDT); (j) 2,3,7,8-tetrachlorodibenzo-p-dioxin (500 ng/l, TCDD); (k) valproic acid (50 mg/l, VA); (l) vehicle 1 control (VC1): embryo water alone (for Cd, MeHg, Pb, As, VA, AA treatments); (m) vehicle 2 control (VC2): 0.2% ethanol control (for 4CA, DDT, tBHQ, PCB); (n) vehicle 3 control (VC3): 0.025% DMSO, 1.4 mg/l toluene (for TCDD). Embryos showed frequently a bent body axis and developed pericardial edema upon further cultivation. |
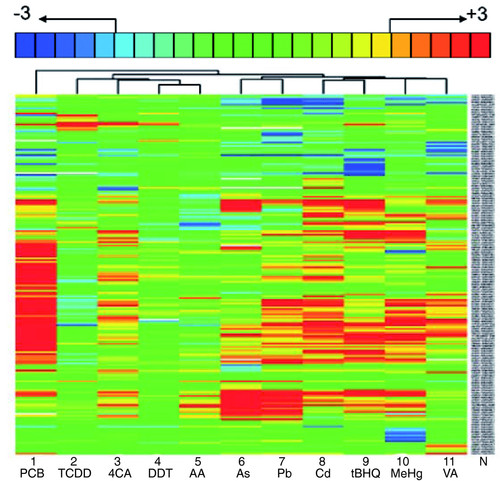
Toxicants induce highly specific toxicogenomic profiles. Hierarchical clustering of gene responses in embryos treated between 96 and 120 hpf with PCB (33 mg/l), TCDD (500 ng/l), 4CA (50 mg/l), DDT (15 mg/l), AA (71 mg/l), As (79 mg/l), Pb (2.8 mg/l), Cd (5 mg/l), tBHQ (1.7 mg/l), MeHg (60 μg/l), VA (50 mg/l). For each toxicant exposure, vehicle controls were carried out in parallel. The gene names are indicated (N) and are legible upon magnification of the PDF version of this figure. The key at the top indicates the color code for fold changes ranging from threefold upregulated (+3, red) to threefold downregulated (-3, blue). Fold changes greater than three are not indicated explicitly but are included. Only genes are listed whose mRNA levels changed by more than twofold (padj < 0.025) in at least one of the treatments. The data represent the average over all biological and technical repeats (see Table 1). |
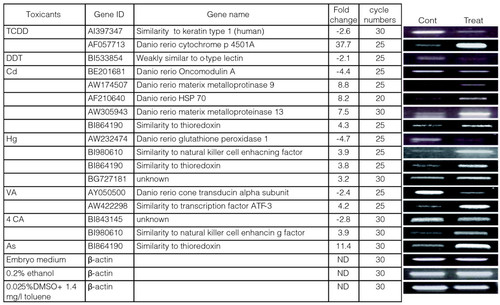
RT-PCR analysis confirms selected gene responses. Embryos were exposed to the indicated toxicants (500 ng/l TCDD; 15 mg/l DTT; 5 mg/l Cd; 60 μg/l MeHg; 50 mg/l VA; 50 mg/l 4CA; 79 mg/l As) or vehicle alone (embryo medium or 0.2% ethanol or 0.025% DMSO, 1.4 mg/l toluene) between 96 and 120 hpf. (a) cDNA was synthesized and subjected to PCR with primers specific for the selected genes indicated. Gene ID refers to the accession number in GenBank. The number of temperature cycles (cycle numbers) for every set of amplifications is indicated. The fold-change column summarizes the results from the microarray experiments for comparison with the RT-PCR results shown in (b). See legend of Figure 1 for details of treatments and controls. β-actin mRNA was used as a toxicant-insensitive reference. ND, not determined, as the actin gene response fell into the class of nonregulated genes in the microarray results. EXPRESSION / LABELING:
|
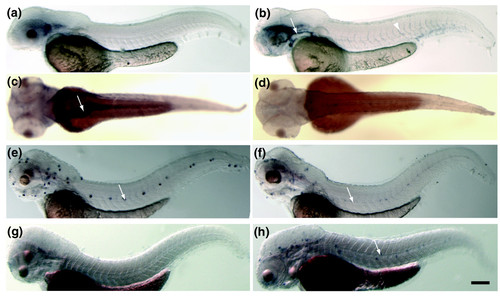
Examples of toxicant-responsive genes that are expressed in a highly tissue-restricted manner. (a) 48 hpf vehicle 3 control. Figure 1 indicated the exposure embryo from 96 to 120 hpf and (b) 500 ng/l TCDD-treated embryos hybridized to a cytochrome P450 1A1 antisense probe. TCDD-treated embryos showed increased levels of cytochrome P4501A1 mRNA in blood vessels Arrow, primary head sinus, arrowhead, intersegmental vessel. (c) 72 hpf vehicle control 1 and (d) 60 μg/l MeHg-exposed embryos hybridized to a glutathione peroxidase 1 probe. Embryos showed a reduction of mRNA levels in the gut (arrow). Embryos were treated from 4 to 72 hpf and were then fixed for in situ processing. (e) Control embryo and (f) 500 μg/l CdCl2-treated embryo hybridized to oncomodulin A antisense mRNA. Oncomodulin A mRNA levels are downregulated in the hair cells of the lateral-line organ (arrow) in response to Cd exposure. (g) Control and (h) Cd-treated embryos hybridized to a thioredoxin antisense probe. Thioredoxin is upregulated in the hair cells of the neuromasts (arrow). Embryos are oriented anterior to the left and dorsal up (a,b,e-h) or with dorsal side facing (c,d). Scale bar represents 220 μm. EXPRESSION / LABELING:
|
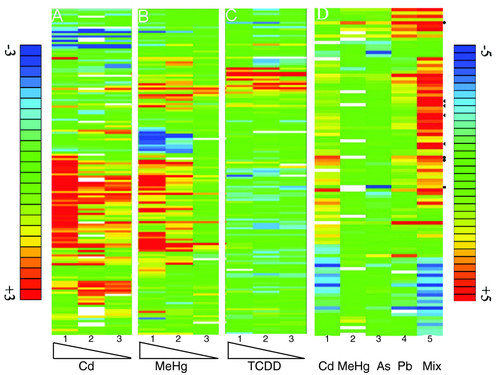
The concentration dependence of toxicogenomic responses and the synergistic effects of low doses. (a-c) Embryos were exposed to decreasing concentrations of Cd (a, lane 1, 5 mg/l: lane 2, 2.5 mg/l; lane 3, 0.5 mg/l), or MeHg (b, lane 1, 60 μg/l; lane 2, 30 μg/l; lane 3, 6 μg/l) or TCDD (c, lane 1, 500 ng/l; lane 2, 250 ng/l; lane 3, 50 ng/l). The low concentrations elicit significant changes in gene expression. (d) Embryos were exposed either to 50 μg/l Cd (lane 1) or 6 μg/l MeHg (lane 2) or 7.9 mg/l As (lane 3) or 280 μg/l Pb (lane 4) alone, or to a mixture (Mix, lane 5) of Cd (50 μg/l), Pb (280 μg/l), MeHg (6 μg/l) and As (7.9 mg/l). The mixture shows a strongly increased response with respect to the degree of changes of expression of individual genes (dark red and dark blue bars). Arrowheads point to examples of synergistic responses whereas the dots highlight genes whose response seems to be additive. The square indicates a gene that was downregulated by As and slightly upregulat individual genes (dark red and dark blue bars). Arrowheads point to examples of synergistic responses whereas the dots highlight genes whose resed by the mixture. All exposures were performed between 96 and 120 hpf. The color key for fold changes in gene expression in (a-c) is indicated on the left and ranges from threefold upregulated (red) to threefold downregulated (blue). The color key for (d) is on the right and ranges from fivefold upregulated (red) to fivefold downregulated (blue). White bars indicate missing data. Only genes were listed whose mRNA levels changed by at least twofold (padj < 0.025) in at least one of the treatments. The data represent the average over all biological and technical repeats (see Table 1). |