
- Title
-
Localized rbp4 expression in the yolk syncytial layer plays a role in yolk cell extension and early liver development
- Authors
- Li, Z., Korzh, V., and Gong, Z.
- Source
- Full text @ BMC Dev. Biol.
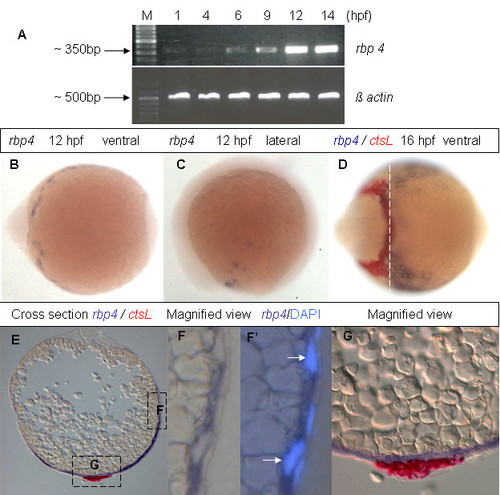
Expression of rbp4 mRNA during early zebrafish embryogenesis. (A) RT-PCR analysis of rbp4 mRNA in wild-type embryos from 1 hpf to 14 hpf. β-actin was used as loading control. M, 100 bp DNA marker. (B, C) Ventral (B) and lateral (C) view of 12 hpf embryos with rbp4 expression as detected by WISH. (D) Ventral view of 16 hpf embryos with expression of ctsL (red) and rbp4 (blue) as detected by two-colour WISH. (E) Cross section of the two color hybridized embyos in (D) as indicated by the dashed line. (F, F′) Magnified view of boxed region F in Panel (E). F, bright field. F′, compound image of DIC/fluorescence reveals rbp4 expression and position of nuclei detected by DAPI staining. Arrows indicate YSL nuclei. (G), Magnified view of boxed region G in Panel (E). EXPRESSION / LABELING:
|
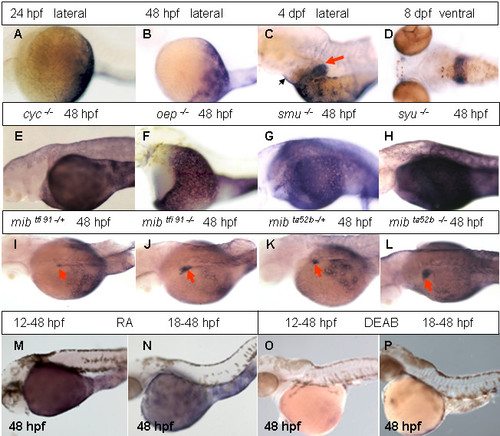
Analyses of rbp4 expression during late development and its regulation. (A-D) rbp4 expression in 24 hpf, 48 hpf, 4 dpf and 8 dpf wild-type embryos as indicated. A red arrow indicates the liver while a black arrow indicates the pericardium region. (E-H) rbp4 expression in cyc-/-, oep-/-, smu-/- and syu-/- embryos at 48 hpf as indicated. (I – L) rbp4 expression in various heterozygous and homozygous mib mutant embryos as indicated. Red arrows indicate the liver. Note precocious appearance of rbp4 expression in homozygous mutant liver at 48 hpf (J, L) compared to heterozygous mib embryos (I, K). (M, N) rbp4 expression in 48 hpf embryos treated with 10-6 M RA initiated from 12 hpf (M) or 18 hpf (N). (O, P) rbp4 expression in 48 hpf embryos treated with 10-5 M DEAB initiated from 12 hpf (O) and 18 hpf (P). |
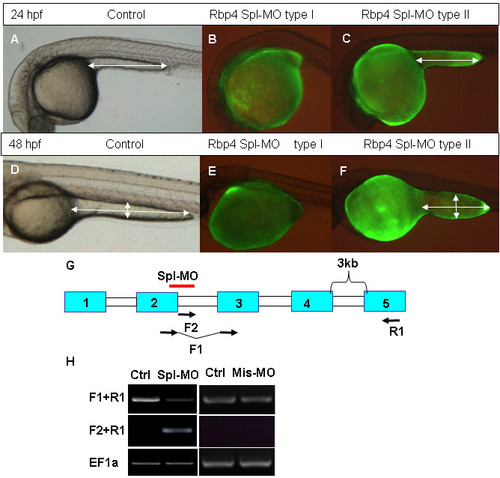
Effects of Rbp4 splicing MO on morphology of embryos. Rbp4 Spl-MO was injected into the blastoderm margin area at 4 hpf with Fluorescein and injected embryos were photographed at 24 hpf and 48 hpf. (A, D) Control embryos at 24 hpf and 48 hpf. (B, E) Fluorescent lateral view image of type I phenotype (without yolk cell extension) morphants at 24 hpf (B) and 48 hpf (E). (C, F) fluorescent lateral view image of type II phenotype (short yolk cell extension) morphants at 24 hpf (C) and 48 hpf (F). White double arrows indicate the length and width of yolk extension. (G) Scheme of splicing morpholino and RT-PCR primer positions in the rbp4 gene. Exons are represented by blue boxes with numbers and introns by white boxes. A red bar indicates the region targeted by Rbp4 Spl-MO. (H) RT-PCR analysis of RNAs from control (Ctrl) (non-injection)/splcing morphlino injected embryos (Spl-MO) and control (Ctrl) (non-injection)/mismatch morpholino injected embryos (Mis-MO) at 24 hpf using the rbp4 primers as indicated in Panel (G) or EF1a control primers. |
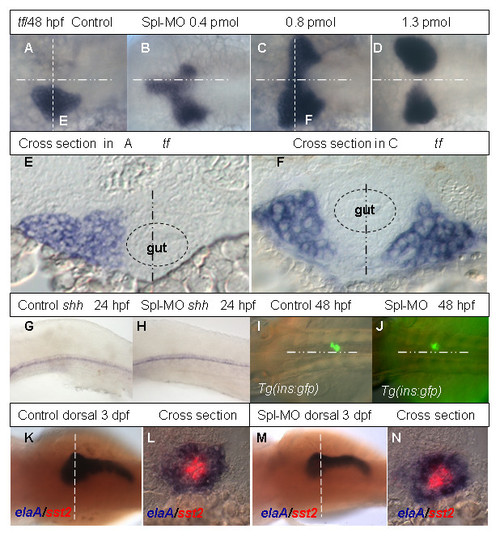
Analyses of liver and pancreas development in Rbp4 morphants. (A-D) Dorsal view of transferrin expression at 48 hpf in a control embryo (A) and in 48 hpf embryos injected with increasing dosage of Spl MO as indicated (B-D). The midline is indicated by a horizontal point/dash line. (E, F) Cross sections of the control embryo in (A) and morphant in (C) respectively. The section plane is indicated in (A, C) by the vertical dash line. Dashed circles in (E, F) represent gut and the vertical poin/dash lines indicate the midline. (G, H) Lateral view of shh expression in 24 hpf control embryo (G) and morphant (H). (I, J) Dorsal view of GFP expression in the principle islet of pancreas in 48 hpf control Tg(ins:gfp) embryo (I) and morphant (J). (K-N) Control and morphant stained using two-color WISH with fluorescein-labeled somatostatin 2(red) and Dig-labeled elaA (blue). Panels (K, M) shows dorsal views of 3 dpf control and morphant respectively. Panels (L, N) are cross section at the planes as indicated in (K, M). Abbreviations: elaA, elastaseA; sst2, somatostatin 2; shh, sonic hedgehog; tf, transferrin. EXPRESSION / LABELING:
PHENOTYPE:
|
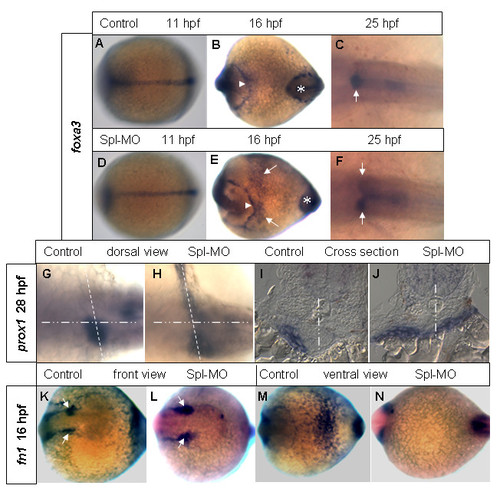
Rbp4 MO affects the early events of liver patterning prior to formation of liver bud. (A-F) foxa3 expression in both control (A-C) and rbp4 morphant (D-F) at 11 hpf (A, D), 16 hpf (B, E) and 25 hpf (C, F) respectively. In (B) and (E), triangles indicate the hatching gland and asterisks the tail bud. The arrows in (E) indicate the ectopic foxa3 expression in rbp4 morphant. The arrows in (C, F) indicate the liver buds. (G, H) Dorsal view of prox1 expression at 28 hpf in whole mount control (G) and morphant (H) embryos. (I, J) Cross section of the embryos as indicated by the dashed lines in (G, H) respectively. The point/dash lines represent midline of the embryos. (K-N), fn1 expression at 16 hpf in control (K, M) and rbp4 morphant (L, N): front view (K, L) and ventral view (M, N). The arrows in K and L indicate the fn1 expression in anterior lateral plate mesoderm. EXPRESSION / LABELING:
|

Unillustrated author statements |