
- Title
-
Reciprocal endoderm-mesoderm interactions mediated by fgf24 and fgf10 govern pancreas development
- Authors
- Manfroid, I., Delporte, F., Baudhuin, A., Motte, P., Neumann, C.J., Voz, M.L., Martial, J.A., and Peers, B.
- Source
- Full text @ Development
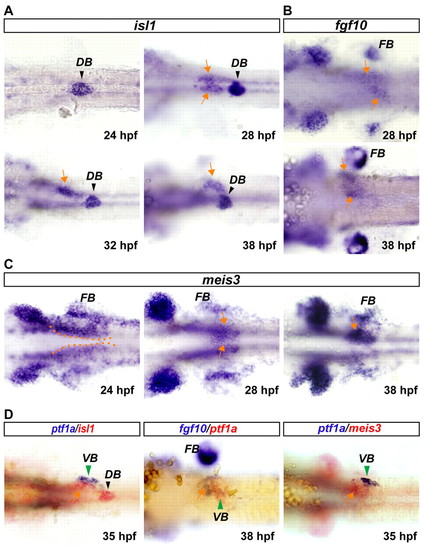
isl1, fgf10 and meis3 expression adjacent to the pancreatic ventral bud. Embryos analyzed by whole-mount in situ hybridization for the expression of isl1, fgf10 and meis3. Images are ventral views of the trunk embryo, with the anterior oriented to left and the left side of the embryo to the top. (A) isl1 expression from 24 to 36 hpf. (B) fgf10 expression at 28 and 36 hpf. (C) meis3 expression from 24 to 36 hpf. Dotted yellow lines highlight the bilateral expression domain. (D) Double-labeled whole-mount in situ hybridization showing the expression of isl1, fgf10 and meis3 compared with ptf1a. Yellow arrows indicate expression of isl1, meis3 and fgf10 in a tissue adjacent to the ventral pancreatic bud. DB, dorsal pancreatic bud; FB, pectoral fin bud; VB, ventral pancreatic bud. Magnification, 200x. |
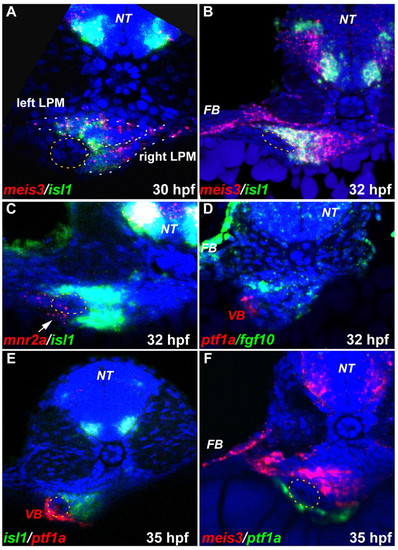
isl1 and meis3 label the LPM next to the developing ventral pancreatic bud. Confocal analysis of transverse sections of embryos stained by fluorescent whole-mount in situ hybridization with two probes (red and green) through the pancreatic region. Nuclear staining was achieved with TO-PRO-3 (633 nm) and artificially colored in blue. The left side of the embryo is situated to the left in all panels. (A,B) meis3 (red) and isl1 (green) expression at 30 hpf (A) and 32 hpf (B). (C) isl1 expression with mnr2a at 32 hpf. (D) Expression of fgf10 (green) and ptf1a (red) at 32 hpf. (E) isl1 (green) and ptf1a (red) expression at 35 hpf. (F) meis3 (red) and ptf1a (green) expression at 35 hpf. On transverse section in A, the white dotted lines highlight the left and right LPM. In A-F, the yellow dotted lines encircle the gut tube. The white arrows indicate the appearing ventral bud cells. Owing to the low levels of mnr2a and fgf10 expression, the views in C and D are flat stacking of several consecutive optical sections. VB, ventral pancreatic bud; DB, dorsal pancreatic bud; FB, pectoral fin bud; NT, neural tube. EXPRESSION / LABELING:
|
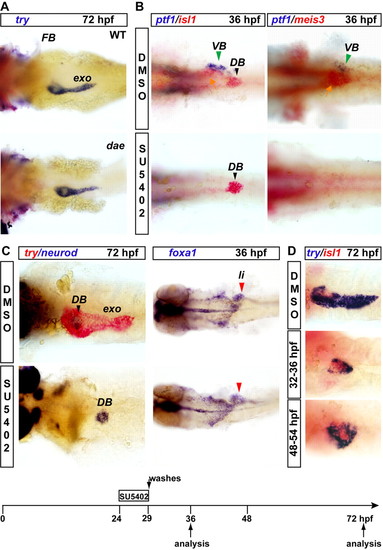
Inhibition of FGF signaling, but not Fgf10, impairs specification of the ventral pancreatic bud and the expression of isl1 and meis3 in the adjacent pancreatic LPM. (A) trypsin (try) expression analysis in wild-type embryos (WT, top) and in fgf10-/- mutants (dae, bottom) at 72 hpf. Note the underdeveloped pectoral fin bud in the dae mutant. (B) Expression of ptf1a (blue), isl1 and meis3 (red) at 36 hpf in embryos treated with the FGF signaling inhibitor SU5402 from 24 to 29 hpf. (C) Expression of trypsin (red) and neurod (blue) at 72 hpf after the same treatment as in B and analysis of the endodermal marker foxa1 at 36 hpf upon SU5402 treatment. Note that the liver and the rest of the endoderm are clearly labeled whereas, at this stage, the pancreas is almost undetectable. The SU5402 treatment analyzed in B and C is schematized at the bottom of the panel. (D) trypsin (blue) and isl1 (red) expression at 72 hpf in embryos exposed to SU5402 from 32 to 36 hpf and from 48 to 54 hpf. The green arrowhead indicates the ventral pancreatic bud (VB); the black arrowhead indicates the dorsal bud (DB); and the yellow arrow indicates the pancreatic LPM adjacent to the ventral bud. exo, exocrine tissue; li, liver; FB, pectoral fin bud. EXPRESSION / LABELING:
|
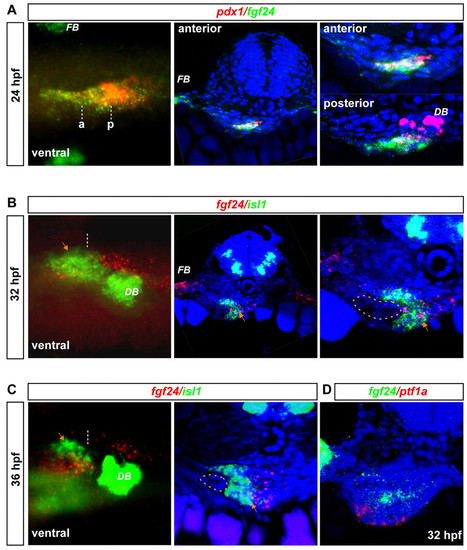
fgf24 is expressed in the pancreatic endoderm and in the pancreatic LPM prior to and during ventral pancreatic bud formation. (A) fgf24 (green) expression analysis by fluorescent whole-mount in situ hybridization at 24 hpf with pdx1 probe (red). A whole-mount ventral view (epifluorescence microscopy) is shown on the left panel (anterior to the left and left side of the embryo up) with anterior (a) and posterior (p) level of section. The transverse sections were analyzed by confocal microscopy, through the anterior pancreatic domain (middle panel, global view; right panel, close-up) and more posteriorly, through the dorsal pancreatic bud (right panel, close-up). (B) Expression of fgf24 (red) compared with isl1 (green) at 32 hpf (transverse section, close-up in the right panel). Expression in the pancreatic LPM is indicated by orange arrows. (C) fgf24 and isl expression at 36 hpf. fgf24 expression appears as small red grains owing to its weak expression. (D) fgf24 (green) and ptf1a (red) expression at 32 hpf. The images of transverse sections presented in B and C are flat stacking of several consecutive optical sections. DB, dorsal pancreatic bud; FB, pectoral fin bud. |
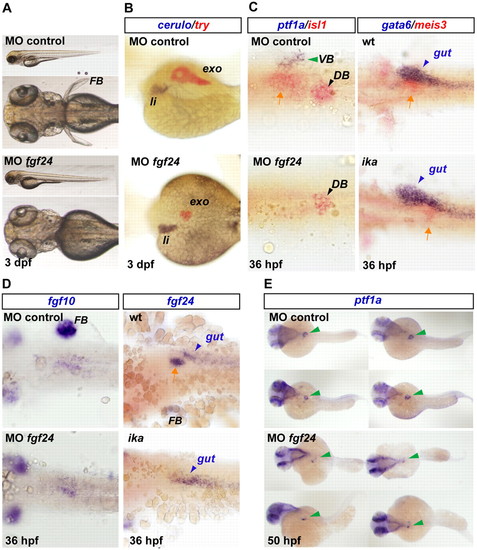
fgf24 is required for the specification of the ventral pancreatic bud. (A) General morphology of a MO fgf24-injected embryo at 3 dpf compared with a control injected embryo. Identical results were obtained with mutants and morphants and illustration in morphants or mutants is stated on the images. (B) trypsin (try) and ceruloplasmin (cp) expression in fgf24 loss-of-function embryos at 3 dpf. trypsin was reduced in 80% (n=121) of embryos, whereas cp was not affected. (C) Expression of the ventral bud marker ptf1a and of the pancreatic LPM marker isl1, or of the gut marker gata6 and the pancreatic LPM gene meis3 at 36 hpf. ptf1a was absent in 32% and reduced in 59% of the embryos (n=146). isl1 was absent in 17% or reduced in 80% (n=81) of embryos, and meis3 was reduced in 72% (n=95). The orange arrows indicate expression in the pancreatic LPM. (D) fgf10 and fgf24 expression at 36 hpf in the pancreatic region in fgf24 loss-of-function embryos. fgf24 was repressed in the pancreatic LPM in 52% of the embryos (n=96). (E) ptf1a (green arrowheads) was expressed at 50 hpf in both control and the fgf24 loss-of-function embryos. DB, dorsal pancreatic bud; FB, pectoral fin buds; VB, ventral pancreatic bud. EXPRESSION / LABELING:
PHENOTYPE:
|

The pancreatic LPM is a target of fgf24 expressed within the endoderm. (A,B) Expression analysis of the FGF target genes pea3 (A) and erm (B) just before and during specification of the ventral pancreatic bud from 26 to 36 hpf. Right panel in A, pea3 (blue) and ptf1a (red) expression in fgf24 loss-of-function embryos. The green arrowheads indicate the ventral pancreatic bud (VB) and the orange arrows point to the pancreatic LPM. Right panel in B, erm (blue) and ptf1a (red) expression at 36 hpf. (C) Expression of ptf1a (blue) and meis3 (30 and 36 hpf) and isl1 (36 hpf) in red in casanova (cas) mutants. The yellow dotted lines underline the LPM labeled by meis3. DB, dorsal pancreatic bud; FB, pectoral fin buds. |
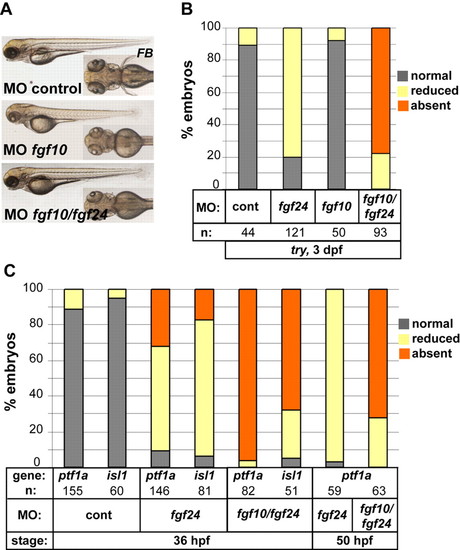
fgf24 and fgf10 cooperate to specify the ventral pancreatic bud. (A) Overall morphology of fgf10 and fgf10/fgf24 morphants at 3 dpf. Note the absence of pectoral fin buds in both morphants. (B) trypsin (try) expression at 3 dpf in embryos injected with MO control, MO fgf24, MO fgf10 and with a combination of MO fgf10 and MO fgf24. Data are presented as the percentage of embryos displaying normal, reduced, or absent expression of trypsin. (C) Expression analysis reported as in B, as the percentage of embryos expressing ptf1a in the ventral pancreatic bud and the pancreatic LPM marker isl1 in MO-injected embryos at 36 and 50 hpf. FB, pectoral fin bud; n, number of analyzed injected embryos. PHENOTYPE:
|
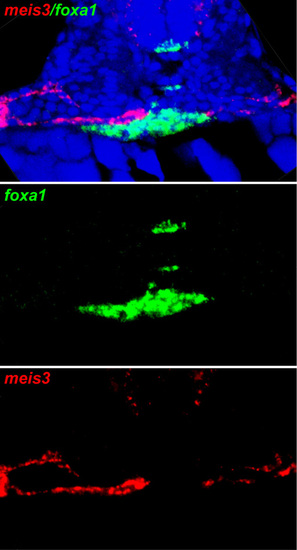
meis3 does not co-localize with the endodermal marker foxa1. Double fluorescent in situ hybridization at 24 hpf showing foxa1 in the endoderm (green) and meis3 (red) in non-overlapping domains. Top: merged color channels with nuclear staining in blue. foxa1 also labels the hypochord and the floor plate. EXPRESSION / LABELING:
|
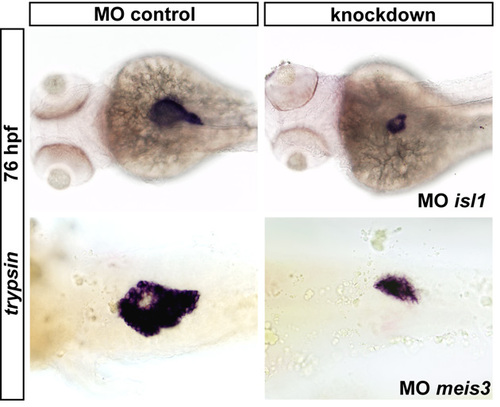
isl1 and meis3 knockdown reduces the exocrine tissue. Embryos were injected with isl1 or meis3 morpholino (MO) and the expression of the exocrine marker trypsin (try) was analyzed by in situ hybridization at 76 hpf. Ventral views, anterior to the left and left side to the top. (A) Control embryos injected with a control morpholino (meis3 MO with five mismatches or unrelated MO). (B) Representative embryo injected with isl1 MO out of the 88% injected embryos exhibiting defects (n=158) (top), and injected with meis3 MO out of the 95% embryos (n=203) (bottom). EXPRESSION / LABELING:
|

erm is expressed in the pancreatic LPM before ventral pancreatic bud induction. erm (green) and isl1 (red) expression at 28 hpf. Two sections in the region of the prospective ventral pancreatic bud are shown. The yellow color results from superposition of strong isl1 and erm expression in the same cells. EXPRESSION / LABELING:
|

fgfr2 is broadly expressed in both the mesoderm and the endoderm within the pancreatic region. The fgfr2 expression domain (green) during pancreas development includes several tissues including the pancreas, as revealed by pdx1 (red), and the lateral plate mesoderm, as shown at 28 hpf. Two sections in the region of the prospective ventral pancreatic bud are shown. EXPRESSION / LABELING:
|