
- Title
-
Repression of the hindbrain developmental program by Cdx factors is required for the specification of the vertebrate spinal cord
- Authors
- Skromne, I., Thorsen, D., Hale, M., Prince, V.E., and Ho, R.K.
- Source
- Full text @ Development
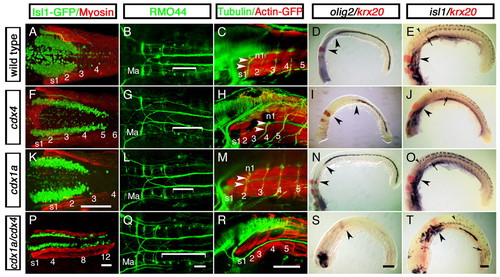
Hindbrain expansion and spinal cord reduction or loss in zebrafish embryos lacking Cdx function. Distribution of hindbrain and spinal cord cell populations in wild-type embryos (A-E) and in cdx4-(F-J), cdx1a- (K-O) and cdx1a/cdx4-(P-T) deficient embryos. (A,F,K,P) Distribution of isl1:GFP-positive vagal motor neurons (green) in relation to adjacent somites (s, red) at 50 hours post-fertilization (hpf). (B,G,L,Q) Distribution of RMO44-immunopositive reticulospinal neurons at 50 hpf. The region occupied by T reticular interneurons is indicated with a bracket. r2 Mauthner neurons are also indicated (Ma). (C,H,M,R) Distribution of spinal motor neurons visualized with an anti-acetylated Tubulin antibody (n, green) in relation to adjacent somites (s, red) at 72 hpf. Axons of the first spinal motor neuron pool are indicated with arrowheads. (D,I,N,S) Distribution of olig2-expressing spinal cord oligodendrocytes (purple) with respect to krx20-expressing r3 and r5 (red) at the 20-somite stage (19 hpf). Distances between r5 and the rostral-most olig2-positive cells are indicated by arrowheads. Forebrain was removed for mounting purposes except in S, where it was retained to show that the in situ hybridization worked in these embryos. (E,J,O,T) Distribution of spinal cord isl1-positive (purple) motor neurons and Rohon-Beard sensory neurons as compared with krx20 expression in r3 and r5 (red) at 20 hpf. The position of r5 (large arrowheads), the most-rostral spinal motor neurons (arrows) and Rohon-Beard sensory neurons (small arrowhead) are indicated. For each condition, a minimum of 40 embryos from five independent experiments were analyzed. A,B,F,G,K,L,Q, dorsal view; K, oblique view; remaining embryos, lateral view. Scale bars: 100 µm for each column, except in K, for A,F,K. EXPRESSION / LABELING:
PHENOTYPE:
|
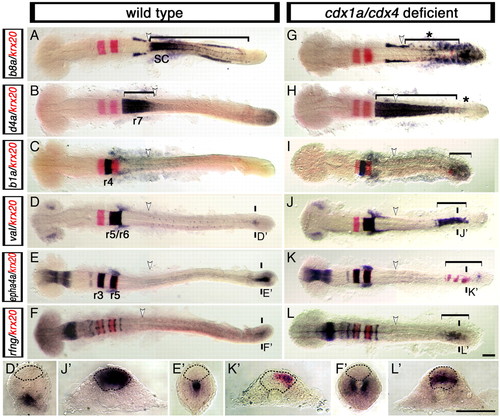
Loss of Cdx function activates the expression of hindbrain genes in the posterior CNS. Expression of hindbrain markers (purple) in wild-type (A-F,D'-F') and cdx1a/cdx4-deficient (G-L,J'-L') zebrafish embryos counterstained for the r3 and r5 marker krx20 (red signal). (A,G) Spinal cord hoxb8a expression (bracket in A) is lost in cdx1a/cdx4-deficient embryos (bracket with asterisk in G). (B,H) r7/8 hoxd4a expression (bracket in B) is expanded caudally in cdx1a/cdx4-deficient embryos (bracket in H) except for the most caudal tip of the CNS (asterisk in H). (C,I) In addition to its normal domain of expression in r4, hoxb1a expression can also be seen in the posterior CNS of cdx1a/cdx4-deficient embryos (bracket in I). (D,J) In the hindbrain, val is expressed in r5 and r6 of wild-type (D) and cdx1a/cdx4-deficient (J) embryos. In the tail region, val is also expressed in the posterior CNS of cdx1a/cdx4-deficient (bracket in J,J') but not wild-type (D') embryos. (E,K) Overlapping expression of epha4a (purple) and krx20 (red) are visualized in r3 and r5 of wild-type (E) and cdx1a/cdx4-deficient (K) embryos. In the tail region, epha4a and krx20 are expressed in the posterior CNS of cdx1a/cdx4-deficient (bracket in K,K') but not wild-type (E') embryos. (F,L) In the hindbrain, radical fringe (rfng) is expressed in seven stripes at the rhombomere boundaries in wild-type (F) and cdx1a/cdx4-deficient embryos (L). In the tail region, rfng is also expressed in the posterior CNS of cdx1a/cdx4-deficient (bracket in L,L') but not wild-type (F') embryos. For each condition, a minimum of 44 embryos from at least three independent experiments were analyzed, with more than 82% of embryos displaying the phenotype shown. Representative 20-somite, stage-matched, whole-mounted embryos are shown in dorsal view, anterior to the left. The position of somite 3, the hindbrain-spinal cord transition in wild-type embryos, is indicated with a white arrowhead. The planes of section are indicated with two short vertical bars. Sections are dorsal to the top, with the neural rod delineated by the dashed line. Scale bars: 100 µm. EXPRESSION / LABELING:
PHENOTYPE:
|
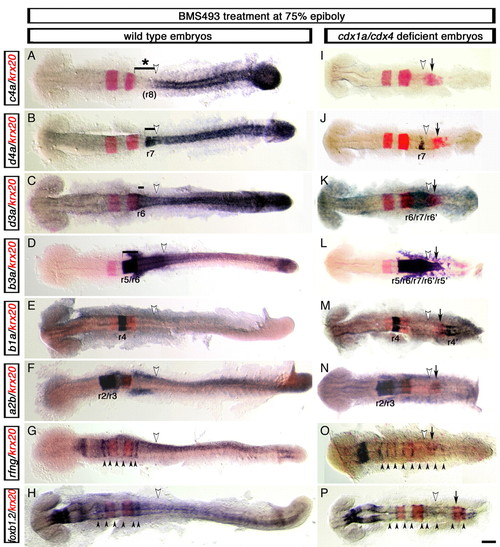
Development of supernumerary rhombomeres and their mirror-image patterning in cdx1a/cdx4-deficient zebrafish embryos with compromised RA signaling. Changes in rfng, foxb1.2 (mar), hox (purple) and krx20 (red) gene expression visualized in wild-type (A-H) and cdx1a/cdx4-deficient (I-P) embryos treated with the retinoic acid (RA) receptor inhibitor BMS493 (BMS) at mid-gastrulation (75% epiboly, 8 hpf). (A,I) hoxc4a expression in r8 is lost in wild-type (bracket with asterisk in A) and cdx1a/cdx4-deficient (I) embryos with compromised RA signaling. (B,J) RA inhibition reduced expression of the r7/8 marker hoxd4a in wild-type (bracket in B) and cdx1a/cdx4-deficient (J) embryos. (C,K) hoxd3a expression in the hindbrain posterior to r5 is reduced in wild-type embryos (bracket in C) and is limited to a central domain of the CNS in cdx1a/cdx4-deficient embryos (K). (D,L) hoxb3a, which is normally expressed posterior to the r4/r5 boundary (bracket in D), is expressed in a central domain in the CNS of cdx1a/cdx4-deficient embryos that includes the krx20 r5 and ectopic expression domains (L). (E,M) hoxb1a is expressed in r4 of wild-type (E) and cdx1a/cdx4-deficient (M) embryos. The latter also shows an additional hoxb1a-positive domain of expression in the posterior CNS. (F,N) hoxa2b is strongly expressed in r2 and r3 and weakly in r4 in wild-type (F) and cdx1a/cdx4-deficient (N) BMS-treated embryos. (G,O) rfng is expressed in six and nine boundary-like stripes (arrowheads) in wild-type (G) and cdx1a/cdx4-deficient (N) BMS-treated embryos, respectively. (H,P) foxb1.2 is expressed in nine boundary-like stripes (arrowheads) in cdx1a/cdx4-deficient BMS-treated embryos (P), compared with the six stripes seen in their wild-type siblings (H). For each condition, a minimum of 44 embryos from at least three independent experiments was analyzed at the equivalent of the 20-somite stage. More than 82% of embryos displayed the phenotype shown. Representative embryos were dorsal flat-mounted, anterior to the left. Ectopic rhombomere-like krx20 domain of expression is labeled with an arrow. Position of somite 3, the hindbrain-spinal cord transition in wild-type embryos, is indicated with a white arrowhead. Supernumerary rhombomeres are labeled r'. Scale bar: 100 µm. EXPRESSION / LABELING:
PHENOTYPE:
|
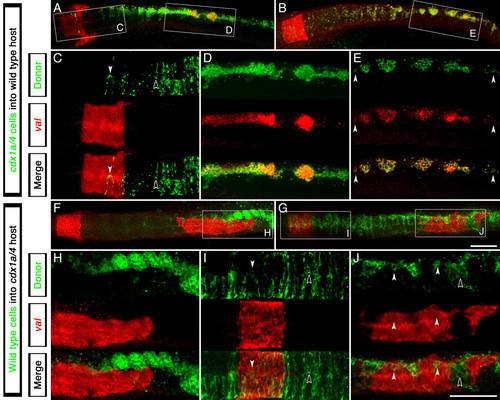
Autonomous requirement of Cdx factors in the zebrafish CNS for hindbrain and spinal cord specification. Expression analysis of the r5/6 marker val (red staining) in clones of cdx1a/cdx4-deficient cells transplanted into wild-type hosts (A-E) or wild-type cells transplanted into cdx1a/cdx4-deficient host embryos (F-J) (transplanted cells in green). (A,B) cdx1a/cdx4-deficient cells can incorporate into the wild-type host CNS at all axial levels. The boxed regions are shown at higher magnification in C-E. (C) cdx1a/cdx4-deficient cells are evenly distributed in hindbrain and spinal cord regions of the CNS, only expressing val when located in the r5/6 territory (white arrowhead compared with black arrowhead). (D,E) cdx1a/cdx4-deficient cells located in the caudal spinal cord tend to form clusters of cells that express val (n=8). Surrounding wild-type cells do not express this marker. Isolated cells also express this gene (arrowheads). (F,H) cdx1a/cdx4-deficient embryos show ectopic val expression in the posterior CNS despite the presence of wild-type cells in the paraxial mesoderm (n=2). (G) Incorporation of wild-type cells throughout the CNS of cdx1a/cdx4-deficient hosts. The boxed regions are shown at higher magnification in I and J. (I) Uniform distribution of wild-type cells in the hindbrain and surrounding regions of cdx1a/cdx4-deficient host embryos. Cells located within the r5/6 region express the marker val (white arrowheads compared with black arrowheads). (J) In the posterior CNS, most wild-type cells segregate in clusters that fail to express val (black arrowhead). When in isolation, wild-type cells express val (white arrowheads, n=5). Confocal 3 µm sections of dorsal flat-mounted embryos, anterior to the left. Scale bars: in G, 100 µm for A,B,F,G; in J, 100 µm for C-E,H-J. |
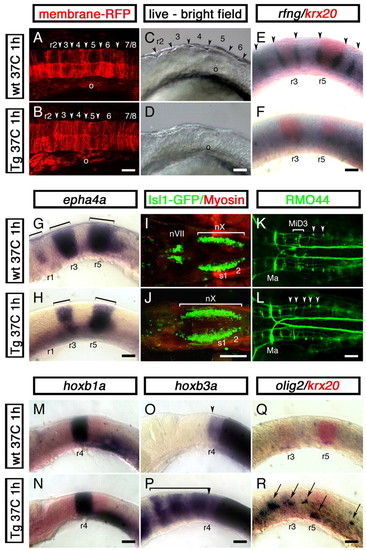
Cdx4 overexpression in the zebrafish hindbrain disrupts rhombomere formation and promotes spinal cord development. Wild-type embryos (A,C,E,G,I,K,M,O,Q) and their siblings carrying one copy of a phsp70:cdx4 transgene (B,D,F,H,J,L,N,P,R) were heat shocked for 1 hour at 37°C at the three-somite stage and then grown at 28°C for a total of 16 (14 somites, A,B), 19 (20 somites, C-H,M-R) or 50 (I-L) hours. (A,B) Confocal images of the hindbrain region of 14-somite stage embryos injected with membrane-anchored RFP (gap43-RFP) mRNA to reveal rhombomere furrow formation (arrowhead). In all 12 embryos examined, cdx4 overexpression impaired furrow formation. (C,D) Distinctive rhombomere bulges (arrowheads in C) fail to appear in cdx4-overexpressing embryos (D) at the 20-somite stage (n=15). (E,F) Embryos overexpressing cdx4 fail to express the rhombomere boundary marker rfng (purple, arrowheads). krx20 expression was used to visualize r3 and r5 (red). (G,H) Loss of epha4a expression in r1 and reduction in r3 and r5 (brackets) in embryos overexpressing cdx4. (I,J) cdx4 overexpression results in the rostral expansion of vagal (nX) motor neurons and the loss of facial (nVII) and trigeminal (nV, not shown) motor neurons in isl1-GFP embryos. (K,L) In wild-type embryos, the RMO44-positive MiD3 reticulospinal neurons are found forming a cluster in r6 (brackets, K). This cluster is replaced by individual r7/8-like, T reticular interneurons in cdx4-overexpressing embryos (arrowheads, L). On a few occasions, MiD2 (r5) and Mauthner (r2) neurons (Ma) were also lost in cdx4-overexpressing embryos (data not shown). (M,N) Expression of the r4 marker hoxb1a is not affected in embryos overexpressing cdx4. (O,P) hoxb3a, a gene that is normally transcribed in rhombomeres posterior to r4 (O, arrowhead), is expressed throughout the rostral hindbrain in cdx4-overexpressing embryos (bracket in P). (Q,R) cdx4 overexpression induces ectopic hindbrain expression of the spinal motor neuron and oligodendrocyte marker olig2 (purple, arrows in R). For the 20-somite stage embryos (C-H,M-R), a minimum of 36 embryos from at least three independent experiments were analyzed. All embryos mounted anterior to the left, lateral views except for A,B,I-L, which are dorsal. o, otic vesicle; r, rhombomere; s, somite. Scale bars: 100 µm. |
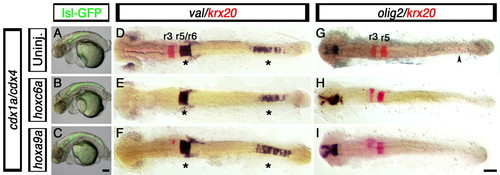
Hindbrain and spinal cord defects associated with loss of Cdx function are not rescued by posterior Hox gene overexpression. (A-I) Branchial motor neuron distribution (A-C, GFP-positive cells), hindbrain markers krx20 (D-I, red) and val (D-F, purple), and spinal cord oligodendtrocyte marker olig2 (G-I, purple staining), in cdx1a/cdx4-deficient zebrafish embryos injected with 25 pg of hoxc6a and hoxa9a mRNA. (A-C) At 50 hpf, control and hoxc6a and hoxa9a mRNA-injected cdx1a/cdx4-deficient, isl1:GFP transgenic embryos show GFP-positive branchiomotor neurons throughout the posterior CNS. (D-I) At the 20-somite stage (19 hpf), hoxc6a and hoxa9a overexpression in cdx1a/cdx4-deficient embryos results in reduced krx20 expression in r3 and r5 and its loss in the posterior CNS (E,F,H,I, red; caudal expression indicated with an arrowhead), as compared with uninjected controls (D,G and Fig. 2). (D-F) val expression is maintained in r5/6 and posterior CNS of cdx1a/cdx4-deficient embryos overexpressing posterior Hox genes (see Fig. 2 for wild-type control). (G,I) Posterior Hox gene overexpression does not rescue spinal cord olig2 expression in cdx1a/cdx4-deficient embryos (see Fig. 1 for wild-type control). Embryos shown in lateral (A-C) or dorsal (D-I) views, anterior to the left. Asterisk indicates val expression in hindbrain and posterior CNS. Arrowhead indicates ectopic krx20 expression in the posterior CNS. A minimum of 15 embryos in three independent experiments were analyzed, with more than 90% of embryos displaying the phenotypes shown. Scale bars: 100 µm. EXPRESSION / LABELING:
|
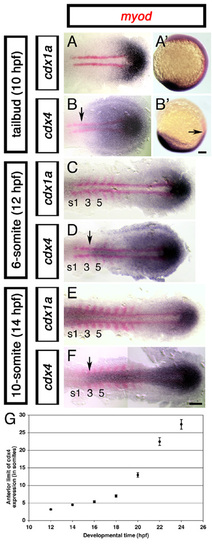
cdx4, but not cdx1a, is expressed in the prospective spinal cord territory before and during somitogenesis. Expression of cdx1a (A,A′,C,E) and cdx4 (B,B′,D,F) (purple) at the tailbud (A,A′,B,B′), 6-somite (C,D) and 10-somite (E,F) stages of development. Arrow indicates anterior limit of cdx4 expression, as compared with adjacent adaxial cells and somites (s) labeled for myod (red). Flat-mounted embryos, anterior to the left, except A′ and B′ which are lateral views of whole embryos, anterior to the top. Scale bars:100 μm. (G) Change in the anterior limit of cdx4 expression in the CNS as a function of time. Embryos at different developmental stages (hpf, hours post-fertilization, x-axis) were hybridized for cdx4 and myod and the anterior limit of cdx4 expression in the CNS analyzed with respect to adjacent somites (y-axis). Each point is the average of at least ten embryos; s.e. indicated with bars. EXPRESSION / LABELING:
|
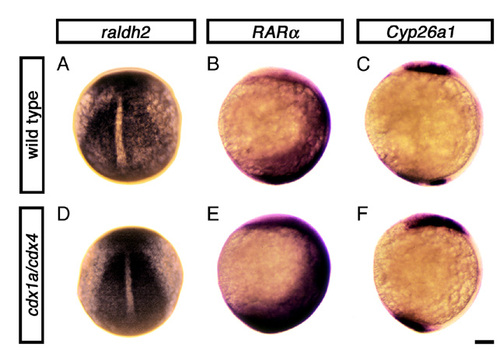
Retinoic acid pathway is not affected in cdx1a/cdx4-deficient embryos at the end of gastrulation. Expression of genes encoding the retinoic acid (RA) -synthesizing enzyme Raldh2 (also known as Aldh1a2 − ZFIN) (A,D), Retinoic acid receptor α (RARα; also known as Raraa − ZFIN) (B,E) and the RA-degrading enzyme Cyp26a1 (C,F) in wild-type (A-C) and cdx1a/cdx4-deficient embryos (D-F) at the end of gastrulation (tailbud stage, 10 hpf). Expression of these genes in the paraxial mesoderm, head and tail regions of cdx1a/cdx4-deficient embryos is similar to that seen in wild-type siblings. More than 40 embryos from two independent experiments were analyzed, all displaying the expression patterns shown. Embryos are shown in dorsal (A,D) or lateral (B,C,E,F) views, anterior to the top. Scale bar: 100 μm. EXPRESSION / LABELING:
|
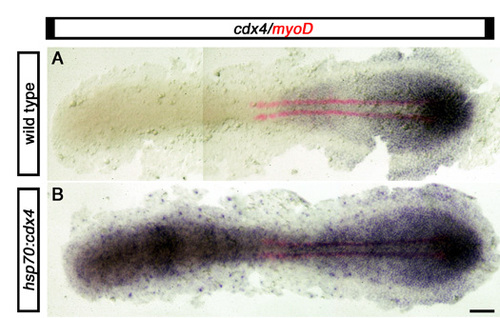
Heat-induced rapid and generalized expression of phsp70:cdx4 transgene. Expression of cdx4 (purple) and myod (red in adaxial cells) in wild-type embryos (A) and their siblings carrying one copy of a phsp70:cdx4 transgene (B) that were heat shocked for 1 hour at 37°C starting at the three-somite stage (11 hpf) and immediately fixed. From three crosses between a wild-type and a transgenic heterozygous fish, 48% of embryos showed ubiquitous cdx4 expression (n=428, B). Upon genotyping, 100% of embryos expressing cdx4 ubiquitously were also positive for the transgene and 100% of embryos with a normal cdx4 pattern of expression tested negative for the transgene (n=20 for each class). Embryos are shown in dorsal view, anterior to the left. Scale bars: 100 μm. EXPRESSION / LABELING:
|
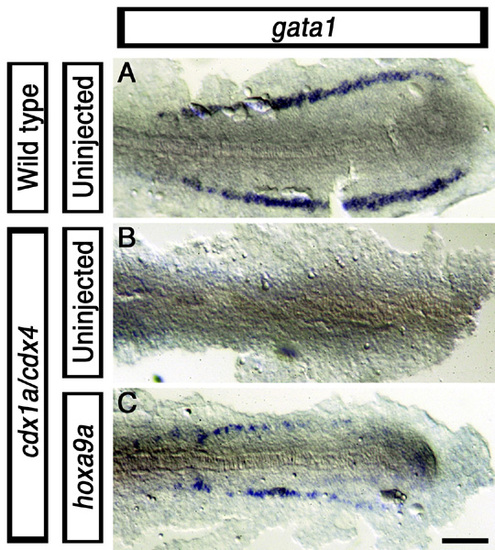
Rescue of blood marker gata1 expression in cdx1a/cdx4-deficient embryos by hoxa9a over-expression. 20-somite stage (19 hpf) wild-type (A), cdx1a/cdx4-deficient (B) and hoxa9a-injected cdx1a/cdx4-deficient (C, 25 pg mRNA) embryos stained for the blood marker gata1 (purple). A minimum of 15 injected embryos in three independent experiments were analyzed, with more than 90% of embryos displaying the phenotypes shown. Scale bar: 100 μm. EXPRESSION / LABELING:
PHENOTYPE:
|