
- Title
-
A role for Piwi and piRNAs in germ cell maintenance and transposon silencing in Zebrafish
- Authors
- Houwing, S., Kamminga, L.M., Berezikov, E., Cronembold, D., Girard, A., van den Elst, H., Filippov, D.V., Blaser, H., Raz, E., Moens, C.B., Plasterk, R.H., Hannon, G.J., Draper, B.W., and Ketting, R.F.
- Source
- Full text @ Cell
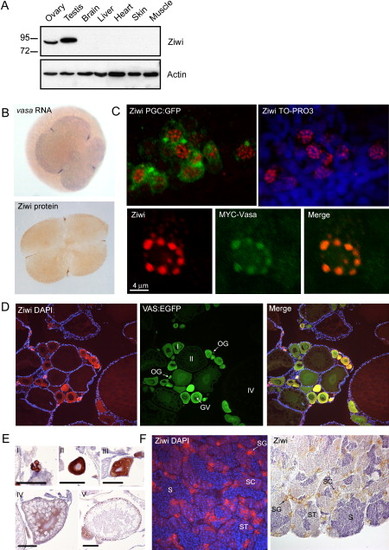
Ziwi Subcellular Localization (A) Western blot shows specific expression of Ziwi in testis and ovary. (B) Ziwi protein is maternally provided and localizes to granules at the cleavage planes in four cell embryos similar to vasa mRNA. (C) At 24 hpf Ziwi (red) localizes to distinct perinuclear granules in the PGCs (upper two panels). These granules also contain Vasa (lower three panels). (D) Ziwi (red) in ovary is expressed in oogonia and stage I oocytes. Vasa (in green) is expressed in all stages of oogenesis. Stages of oogenesis are oogonia (OG), stage I oocytes (7–140 µm; I), stage II oocytes (140–340 μm; II), stage III oocytes (340–690 μm; not in picture; III), and stage IV oocytes (0.69–0.73 mm; Selman et al., 1993). (E) Ziwi expression in various stages of oocytes is visualized by DAB staining to reveal lower levels of expression in later stage oocytes. I indicates oogonia; II indicates Stage I; III indicates Stage II; IV indicates Stage III; and V indicates Early stage V. Scale bar is 100 μm. (F) Ziwi (left panel, red, or right panel, brown) in testis is expressed in spermatogonia and spermatocytes. Stages of spermatogenesis are spermatogonia (SG), spermatocytes (SC), spermatids (ST), and sperm (S). |
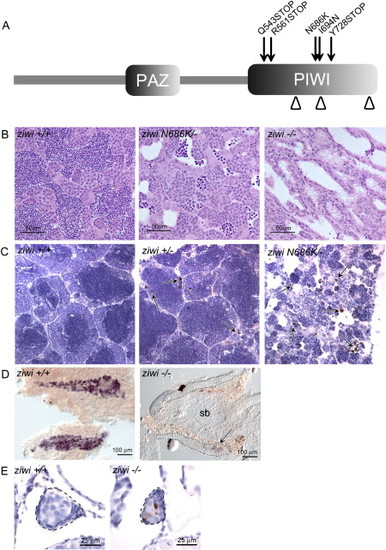
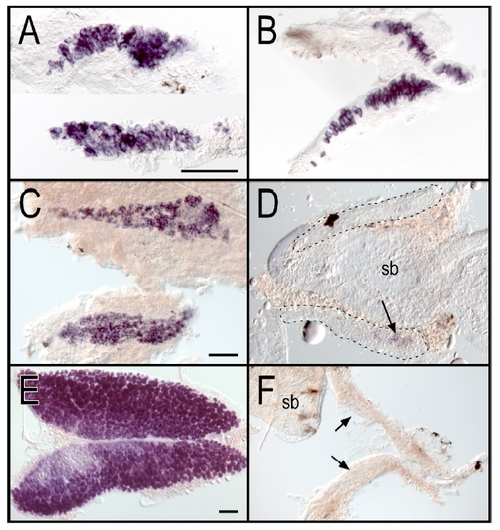
Ziwi Is Necessary for the Maintenance of the Germline (A) Overview of Ziwi with PAZ and PIWI domain is shown. DDH motif is indicated by arrowheads. Three STOP mutations—Q543STOP (hu2479), R561STOP (fh219), and Y728STOP (fh221)—and two missense mutations—N686K (hu2410) and I694N (fh222)—are located in the PIWI domain of ziwi. (B) Hematoxylin and eosin staining of wild-type (left), ziwi(Q543STOP/N686K) (middle), and ziwi(Q543STOP) (right) testis is shown. Ziwi(Q543STOP/N686K) testis show fewer germ cells with almost no sperm. Ziwi(Q543STOP) mutants have germ cell-depleted testis. (C) Caspase-3 staining (brown) shows apoptotic cells, indicated by arrows. In wild-type testis very few apoptotic cells are observed. Heterozygous ziwi(Q543STOP/+) testis show several apoptotic cells, but overall morphology is wild-type. Ziwi(Q543STOP/N686K) transheterozygous mutants have few, if any, sperm cells, and many germ cells are apoptotic. (D) Whole mount in situ hybridization of wild-type and ziwi(R561STOP/Y728STOP) gonads at 20 dpf, with staining for vasa, is shown. Loss of Ziwi leads to a strong reduction in the amount of vasa positive cells. (E) Caspase-3 staining of wild-type and ziwi(hu2479/hu2479) animals at 21 days of development is shown. The developing germline is indicated. Wild-type gonads (n = 3) do not show apoptosis at this point in time, whereas the mutant gonads (n = 3; brown cells) do. EXPRESSION / LABELING:
PHENOTYPE:
|
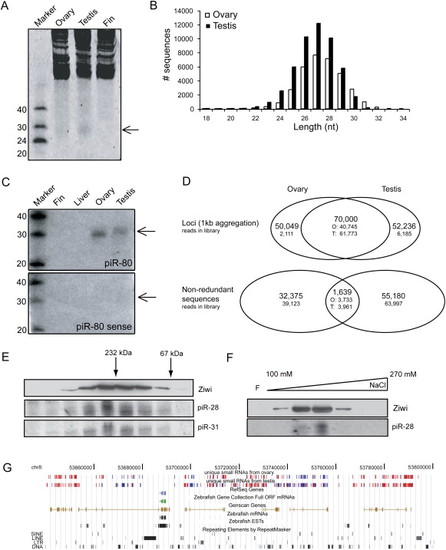
Zebrafish piRNAs in Ovary and Testis (A) SYBRGold staining of 20 μg total RNA is shown. A 28 nt band is visible in testis and ovary but not in fin. (B) Length distribution of cloned small RNAs from zebrafish ovary and testis is shown. (C) Ovary- and testis-specific detection of small RNAs by northern blotting is shown. Sense indicates a probe with same sequence as the cloned piRNA sequence. (D) Graphic representation of the overlap between ovary and testis libraries. In the overlap regions the number of ovary (O)- and testis (T)-derived reads that contribute to the total number of loci or nonredundant sequences are indicated. Loci are defined as regions where two different piRNAs are maximally 1 kb apart. (E) Ziwi cofractionates with piRNAs on a size exclusion column. Upper panel shows western blot for Ziwi. Lower panels show northern blots for piR-28 and piR-31. (F) Ziwi cofractionates with piRNAs on a Resource S column eluted with a salt gradient from 100 mM to 1 M NaCl. Upper panel shows western blot for Ziwi. Lower panel shows northern blot for piR-28. (G) A view from the UCSC browser displays a part of chromosome 8. Red bars depict piRNA reads originating from the positive strand, and blue bars depict reads from the negative strand. Other features of this region are indicated in the figure. |
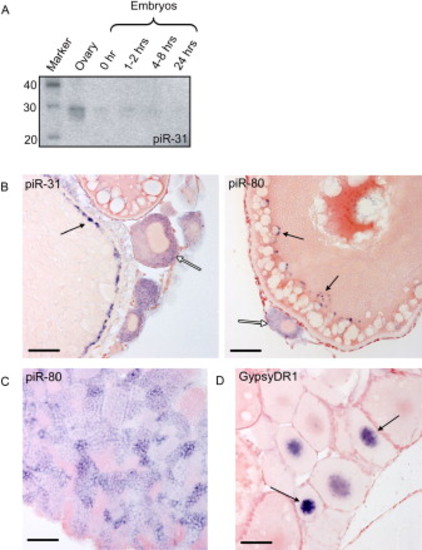
piRNA Expression (A) Northern blot for piRNA piR-31 at various developmental stages is shown. (B) shows piR-31 and piR-80 in situ hybridization on ovary. Open arrows indicate stage I oocytes, displaying staining in the cytoplasm. Closed arrows indicate granules along the cortex of stage III/IV oocytes. Scale bars are 50 μm. (C) piR-80 in situ hybridization on testis is shown. Cytoplasmic staining is observed in all stages, including premeiotic stages, except for sperm. (D) GypsyDR1 in situ hybridization on ovary is shown. Nuclear staining is observed in stage I oocytes and rapidly fades in older stages. |
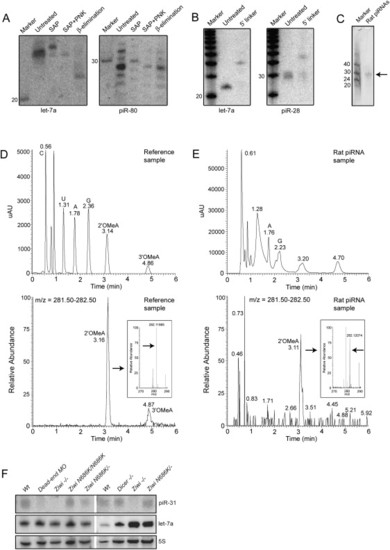
Biochemical and Genetic Analysis of piRNAs (A) Left panel shows a northern blot for let-7a. Samples are treated with Shrimp Alkaline Phosphatase (SAP), SAP+ polynucleotide kinase (PNK), and NaIO4 oxidation followed by β-elimination. The right panel shows the same blot probed for piR-80. (B) Ligation of a 17 nt linker with both 5′ and 3′ hydroxyl groups to both let-7a and piR-28 is shown. (C) Purified rat piRNA is shown. Approximately 0.3% of the purified product was run on a gel and stained with SYBRGold. (D) LC/MS characterization of a mix of synthetic C, A, U, G, 2′-OMeC, 3′-OMeC, 2′-OMeA, and 3′-OMeA is shown. In the top graph UV intensity is plotted versus time. In the lower graph the presence of molecules with an m/z in the range of OMeA (m/z = 282.12) is plotted versus time, revealing peaks at the retention times (RT) of 2′ and 3′-OMeA. The inset shows high resolution m/z determination (RT = 3.06–3.25), with an arrow pointed at the exact mass of 2′-OMeA. Numbers in the graph indicate RT of indicated peak. (E) Similar experiment as in (D) but now with nucleosides derived from rat piRNAs. Two UV peaks are observed around the RT of 2′ and 3′-OMeA. The peak overlapping with 2′-OMeA contains molecules with the mass of OMeA (m/z = 282.12 at RT = 3.05-3.22; lower graph and inset). This species is present in the left shoulder of the UV peak at RT = 3.20. Note that most of the UV signal of the peak at RT = 3.20 does not come from 2′OMeA. The UV peak around the RT of 3′-OMeA contains no species with a molecular weight of 3′-OMeA (not shown). Coinjection with synthetic 2′ and 3′-OMeA confirms these results (Figure S7). (F) Northern blot analysis of piRNA expression is shown in various mutant backgrounds. Upper panel shows a northern blot for piRNA piR-31. The same blot was probed for miRNA let-7a (middle panel) and 5S RNA (lower panel). Note that let-7a is expressed in the somatic germline (not shown), so disruption of dicer in the germ cells has no effect on let-7a processing. |
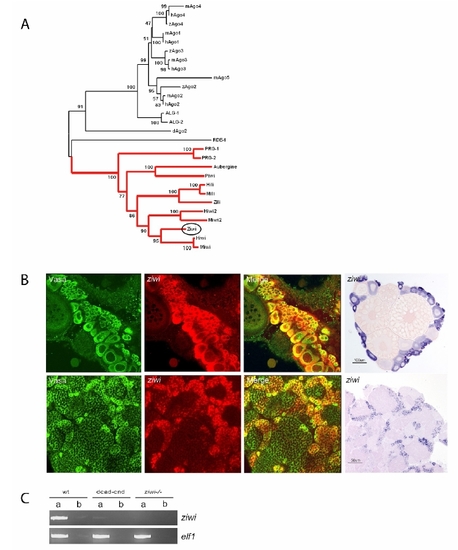
Argonaute family tree and ziwi expression EXPRESSION / LABELING:
|
Loss of germ cells in ziwi mutants EXPRESSION / LABELING:
PHENOTYPE:
|
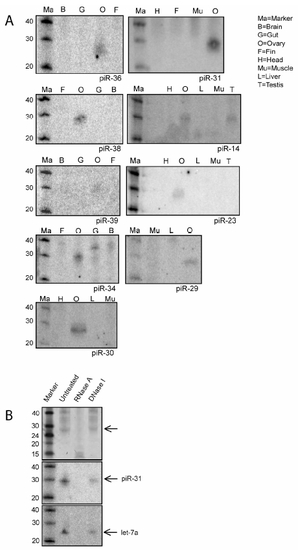
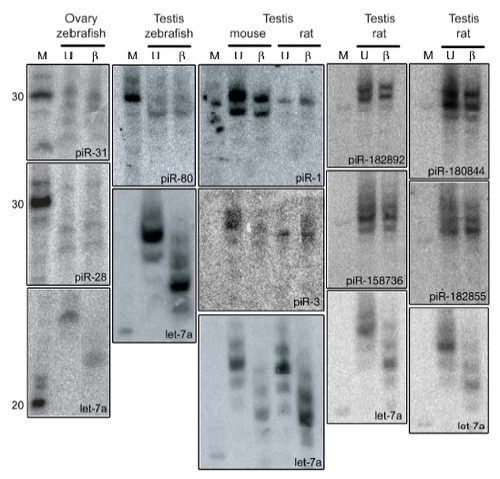
piRNA Northern blots |
piRNAs are resistant to β-elimination |
Reprinted from Cell, 129(1), Houwing, S., Kamminga, L.M., Berezikov, E., Cronembold, D., Girard, A., van den Elst, H., Filippov, D.V., Blaser, H., Raz, E., Moens, C.B., Plasterk, R.H., Hannon, G.J., Draper, B.W., and Ketting, R.F., A role for Piwi and piRNAs in germ cell maintenance and transposon silencing in Zebrafish, 69-82, Copyright (2007) with permission from Elsevier. Full text @ Cell