
- Title
-
Glucocorticoids Play a Key Role in Circadian Cell Cycle Rhythms
- Authors
- Dickmeis, T., Lahiri, K., Nica, G., Vallone, D., Santoriello, C., Neumann, C.J., Hammerschmidt, M., and Foulkes, N.S.
- Source
- Full text @ PLoS Biol.
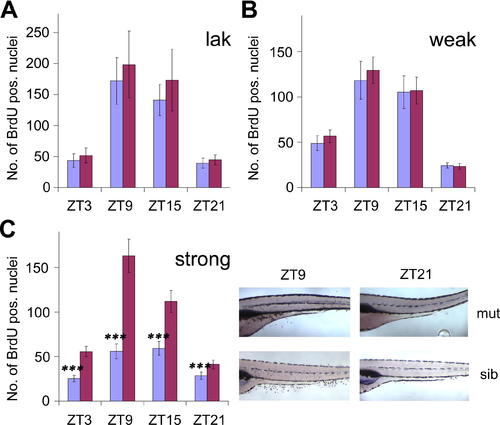
Circadian Cell Cycle Rhythms in Blind Zebrafish Mutants (A) Quantification of BrdU-labeled nuclei in lak mutant larvae and wild-type siblings at four circadian time points. The mean number of positive nuclei between swim bladder and anus (y axis) was plotted against ZT, hours after lights on, lights off at ZT12) (x axis) for mutant (blue) and sibling (red) larvae. Error bars indicate the 95% confidence interval for the mean, and asterisks indicate the statistical significance of differences between mutants and wild-type siblings as measured by the Mann-Whitney-Test. ***, p < 0.001. (B) Quantification of BrdU incorporation analogous to (A) for mutants and siblings of the weak rx3 allele. (C) Left: quantification analogous to (A) for strong rx3 mutants. Right: representative examples of whole-mount stainings used for the quantification. Mutant (mut) and sibling (sib) larvae at peak (ZT9) and trough (ZT21) points of the cell cycle rhythm are shown. Mutant larvae appear darker, because their melanophores are expanded (lack of visual background adaptation in blind fish). A high-resolution image of this part of the figure is provided as Figure S1. Pooled results from two (A), four (B), and nine (C) independent experiments are shown. |
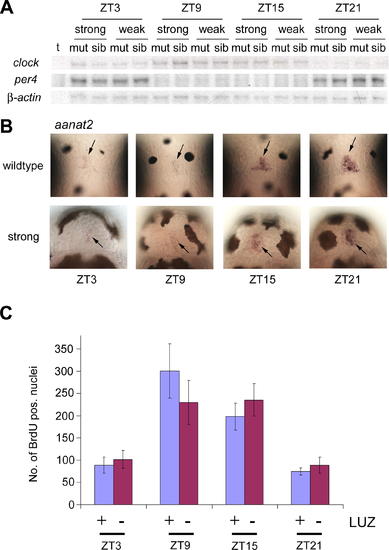
Attenuated Cell Cycle Rhythms Are Not Due to Changes in Circadian Clock Gene Expression or Disturbed Pineal Melatonin Output (A) Circadian expression of clock genes in mutant larvae of both weak and strong alleles of rx3. Representative RNase protection assay results for per4, clock1, and μ-actin expression using RNA harvested at the indicated ZTs. “t” represents a tRNA negative control. (B) Circadian expression of aanat2 in strong rx3 mutants. Whole-mount in situ hybridization for aanat2 in strong rx3 mutants (“strong”) and wild-type siblings (“wildtype”) at four circadian time points (6 dpf). Images show dorsal views of the pineal gland (arrow), rostral up. (C) Quantification of BrdU labeled nuclei in luzindole treated wild-type larvae. Means of BrdU-positive nuclei determined as described in Figure 1 are shown at four circadian time points on 6 dpf for luzindole-treated larvae (+, blue) and control larvae (-, red). Error bars show 95% confidence interval of the mean. EXPRESSION / LABELING:
|
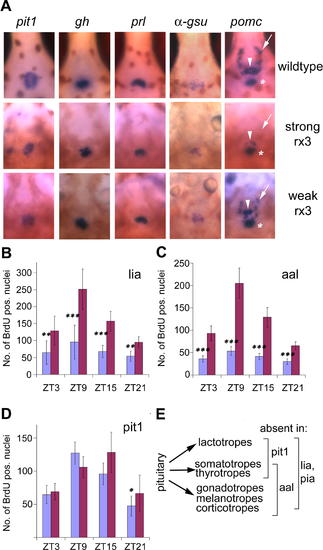
Reduction or Absence of the Pituitary Corticotrope Lineage Results in Attenuated Cell Cycle Rhythms (A) Expression of pituitary markers in rx3 mutants. Whole-mount in situ hybridizations for pit1, growth hormone (gh), prolactin (prl), the glycoprotein hormone alpha subunit (α-gsu), and proopiomelanocortin (pomc) (6 dpf), with ventral views through the jaw cartilages, rostral up. Domains of pomc expression are indicated by arrows (arcuate nucleus), arrowheads (anterior pituitary), and asterisks (posterior pituitary). strong, strong rx3 mutants; weak, weak rx3 mutants; wildtype, wild-type siblings. (B–D) Quantification of BrdU incorporation in the lia (B), aal (C), and pit1 (D) mutants. Mean numbers of BrdU-positive nuclei determined as described in Figure 1 are indicated for each time point for mutants (blue) and siblings (red). Error bars show the 95% confidence interval of the mean; asterisks indicate statistical differences between mutant and wild-type values as determined by the Mann-Whitney test: *, p < 0.05; **, p < 0.01; ***, p < 0.001. Pooled results from two (B), five (C), and four (D) independent experiments are shown. (E) Scheme illustrating the pituitary lineages that are lacking (bracketed) in different pituitary mutants: lia and pia mutants lack all pituitary lineages. aal retains the lactotropes and lacks all other lineages. In pit1, only gonadotropes and corticotropes/melanotropes are present, and lactotropes, thyrotropes, and somatotropes are absent. |
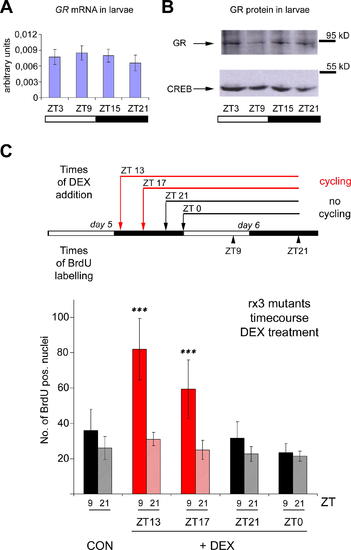
Shorter-Term Treatment with Dexamethasone Also Rescues Cell Cycle Rhythms in Strong rx3 Mutants (A and B) Expression analysis of the zebrafish GR. (A) GR mRNA expression as determined by quantitative RT-PCR in wild-type larvae at four circadian time points. No significant oscillation is apparent (one-way ANOVA [analysis of variance], p = 0.4231). Error bars show the 95% confidence interval of the mean from three independent experiments. As a control, per4 mRNA levels were assayed in the same samples and shown to exhibit a high-amplitude rhythm (unpublished data; see also Figure2A). (B) Representative Western blot showing expression levels of the GR protein (upper) and of CREB (lower) as a loading control. Consistent with mRNA expression levels, no overt oscillation can be observed. (C) Upper panel: experimental design to define a minimum period of exposure to the tonic dexamethasone (DEX) signal required to rescue cell cycle rhythms in the rx3 mutants. Black and white bars represent the light and dark periods of day 5 and 6 post-fertilization. Above: times of DEX addition to the medium. Red arrows and lines indicate treatments that are able to increase the cycling amplitude of BrdU incorporation in strong rx3 mutant larvae, whereas black arrows and lines indicate those that fail to do so. Below: times for BrdU labeling (as 15-min pulses) and harvesting on day 6 (indicated as ZT time points). Lower panel: quantification of BrdU incorporation in strong rx3 mutants following the treatments outlined in the upper panel. Peak (ZT9, dark color) and trough (ZT21, light color) mean values on day 6 are shown for untreated controls (CON) and the four times of DEX addition on day 5 (+DEX). Red bars: treatments that result in a significant difference between peak and trough values (Mann-Whitney-Test; ***, p < 0.001), black bars: no significant differences observed between peak and trough values. Error bars indicate the 95% confidence interval of the mean. Data are pooled from six independent experiments. EXPRESSION / LABELING:
|
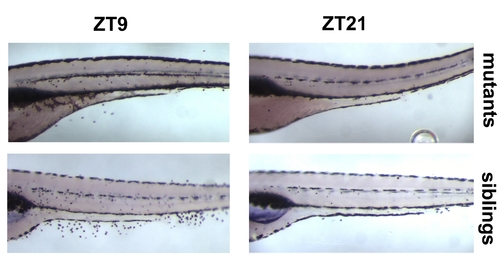
High-Resolution View of Representative Whole-Mount BrdU Stainings Shown in Figure 1. Mutant (mut) and sibling (sib) larvae at peak (ZT9) and trough (ZT21) points of the cell cycle rhythm are shown. |
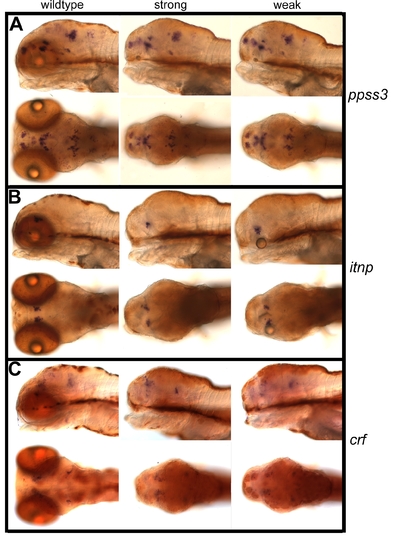
Normal Expression of Hypothalamic Markers in rx3 Mutants. Whole-mount in situ hybridization with probes against somatostatin3 (ppss3) [68] (A), isotocin (itnp) [67] (B), and corticotropin releasing factor (crf) (C) of strong and weak rx3 mutants and wild-type siblings on 6 dpf. For each panel: wild-type (“wildtype”), strong mutant (“strong”), and weak mutant (“weak”); top row shows a lateral view with the anterior end left (in wild-type: left eye removed to allow a better view of the brain stainings), and the bottom row shows a dorsal view with the anterior end left. Expression patterns of these representative probes appear normal, despite the lack of normal eyecups in the mutants. EXPRESSION / LABELING:
|
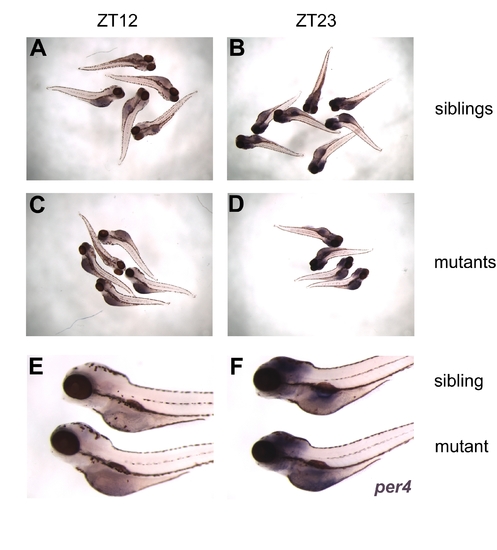
Normal Expression of per4 in aal Mutants. Whole-mount in situ hybridization with probes against per4 of aal mutants and wild-type siblings. Mutants and wild-type siblings were discriminated by co-hybridizing with a probe against growth hormone (unpublished data). (A–D) Overview of staining results for mutants (C and D) and wild-type siblings (A and B) at ZT 12 (A and C) and 23 (B and D). (E and F) Close-ups of mutant and wild-type sibling larvae at ZT12 (E) and ZT23 (F). Strong per4 staining is visible in both mutant and wild-type siblings at ZT23, whereas barely any staining can be detected in larvae of both genotypes at ZT12. EXPRESSION / LABELING:
|