- Title
-
Function and regulation of zebrafish nkx2.2a during development of pancreatic islet and ducts
- Authors
- Pauls, S., Zecchin, E., Tiso, N., Bortolussi, M., and Argenton, F.
- Source
- Full text @ Dev. Biol.
|
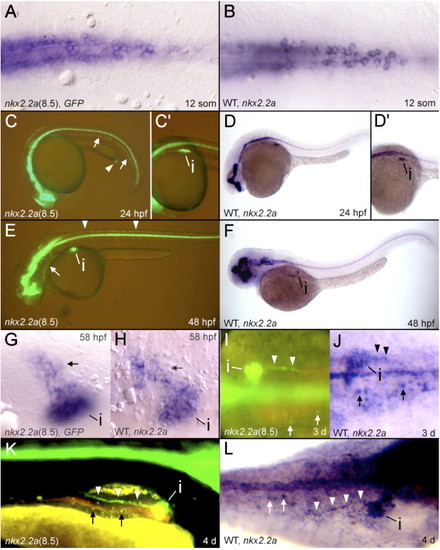
Stable transgenic expression of GFP compared to nkx2.2a mRNA expression. (A, C, C2, E, G, I, K) GFP fluorescence or GFP mRNA expression in transgenic animals. (B, D, D2, F, H, J, L) nkx2.2a in situ hybridizations in WT zebrafish. (C–F, K) Lateral views. (L) Dorsolateral view. (I, J) Dorsal views. (A, B, G, H) Ventral views. (C2, D2) represent the same embryos shown in panels C and D respectively, focusing on pancreatic expression, dorso-lateral views. (C) Hypochord (arrows), proctodeum (arrowhead). (E) Branchial arches (arrow), dorsal spinal cord cells (arrowheads). (G, H) The arrow indicates GFP and nkx2.2a expression anterior and lateral to the pancreatic islet (i). (I–L) The pancreatic duct is indicated by arrowheads and enteroendocrine cells by arrows. i = pancreatic islet. EXPRESSION / LABELING:
|
|
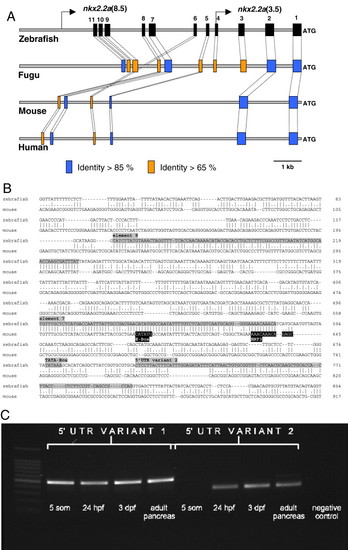
Sequence homology between the regulatory regions of zebrafish nkx2.2a and other vertebrate Nkx2.2 genes. (A) Schematic alignment of four vertebrate Nkx2.2 promoter regions (10 kb). Conserved sequence blocks in the zebrafish sequence are shown as black squares. The degree of identity between a given zebrafish element and the corresponding region in one of the other sequences is indicated by different colours, orange for > 65% identity and blue for > 85% identity. The promoter fragments used for the two transgenic lines are depicted in the zebrafish sequence. (B) Sequence alignment of the zebrafish genomic region containing elements 7 and 8 as well as a sequence identical to 52-region of the identified nkx2.2a EST harbouring an alternative 52UTR (‘variant2’) and the corresponding genomic sequence in mouse. Elements 7 and 8, the region corresponding to the alternative 52UTR and a putative TATA-box are shaded in grey. The conserved E-Box motif and the HNF3 binding motif in the mouse sequence are marked in black. (C) RT-PCR to identify the two variant nkx2.2a transcripts at various developmental stages. Note that mRNA variant 2 is not detectable before the onset of pancreatic hormone gene expression. EXPRESSION / LABELING:
|
|
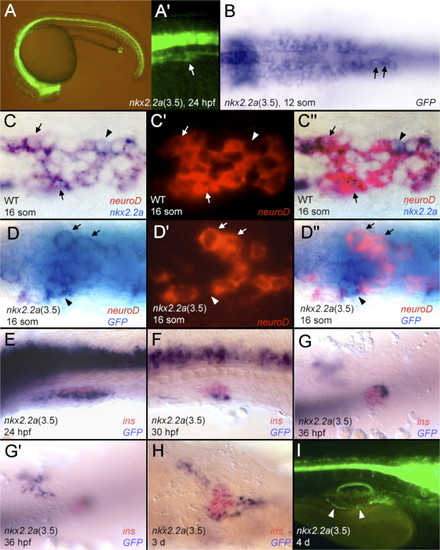
GFP expression under the control of the 3.5 kb promoter fragment. (A, A′, I) GFP fluorescence. (B, D–H) GFP mRNA in blue. (C) nkx2.2a mRNA in blue. (C, D) neuroD mRNA in red. (E–H) insulin mRNA in red. (A, E, F, I) lateral views. (B–D, G, H) Ventral views. (A′) The pancreas of the same embryo shown in panel A at higher magnification (arrow). (B) GFP expression in the endoderm is indicated by arrows. (C, C′, C″) Same embryo, (C′) fluorescence of the neuroD probe, (C″) overlay of panels C and C′. (D, D′, D″) Same embryo, (D′) fluorescence of the neuroD probe, (D″) overlay of panels D and D′. (C, D) Cells labelled by nkx2.2a (C) or GFP (D) and neuroD are indicated by an arrow and cells expressing either nkx2.2a (C) or GFP (D) but not neuroD with an arrowhead. (E–G) Pancreatic islet showing reduction of GFP transcription. (G, G′) Two different focal planes of the same embryo, (G′) anterior pancreatic bud. (I) The pancreatic duct is highlighted by arrowheads, here the anterior is to the right. EXPRESSION / LABELING:
|
|
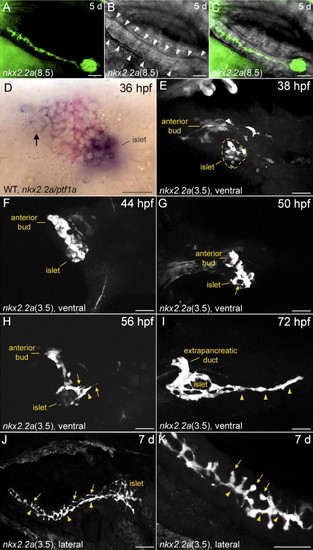
Confocal analysis of pancreatic duct morphogenesis in fixed nkx2.2a:GFP transgenic zebrafish. (A–C) Confocal images of a nkx2.2a(8.5) larva. (D) WT embryo. (E–K) Confocal images of nkx2.2a(3.5) embryos and larvae. (A–C) Lateral view, anterior to the right. (A) Fluorescent pancreatic duct (B) transmission, showing the acinar cells of the pancreatic tail (arrowheads) (C) overlay. (D) Ventral view, double in situ hybridization of nkx2.2a (blue) and ptf1a (red). nkx2.2a-positive cells of the anterior pancreatic bud are marked by an arrow. (E–I) Ventral views, anterior to the left. Different fixed individuals. The intrapancreatic duct is highlighted by arrowheads. The position of the pancreatic islet in panel E is indicated by a dashed circle. Arrows in panels G and H indicate filopodia. (J–K) Lateral view, anterior to the right. Arrows in panels J and K indicate first order branches. Scale bars: A–C and J 50 μm, D–I and K 25 μm. EXPRESSION / LABELING:
|
|
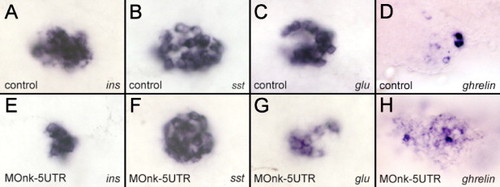
The endocrine pancreas in nkx2.2a-morphant embryos. Ventral views. (A–C, E–G) 32 hpf. (D, H) 48 hpf. Pancreatic hormone expression in control embryos (A–D) and representative MOnk-5UTR injected embryos (E–H). (A, E) Insulin, (B, F) somatostatin, (C, G) glucagon, (D, H) ghrelin. Using ImageJ software we could calculate that insulin expression in panel E is 52% less than control (A), while glucagon expression in panel G is 43% less than control (H). In panel H, ghrelin expression levels are 60% more than control (D). |
|
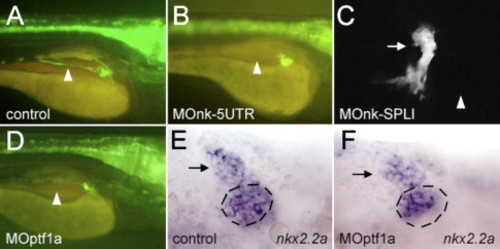
The development of the pancreatic ducts in nkx2.2a- and ptf1a-morphants. (A, B, D) Lateral views, anterior to the right. (C, E, F) Ventral views, anterior to the left. (A, E) Control embryos. (B, C) nkx2.2a-morphant larvae and (D, F) ptf1a-morphants. (A–D) GFP fluorescence in larvae of the nkx2.2(3.5):GFP line at 4 dpf. (A–D) The position of the intrapancreatic duct, which is lacking in panels B–D is indicated by an arrowhead. (C) Confocal image of a nkx2.2a-morphant larva where the extrapancreatic duct is marked by an arrow. A rudimentary duct is pointing in an anterior direction. (E, F) 48 hpf, putative precursors of the extrapancreatic duct express nkx2.2a (arrow) whereas there is a reduced number of nkx2.2a-expressing cells in the medial portion of the nkx2.2a expression domain (this area is marked by a dashed circle). |
|
Examples for transient GFP expression in 4-dpf-old larvae after injection of nkx2.2a promoter fragments fused to Gal4:VP16UASGFP (short: GVPGFP). (A) Fluorescent cells in the brain (arrows) after injection of the nkx2.2a(8.5 kb) promoter fragment. (B) Fluorescent cells in the spinal cord (arrows) after injection of element 2. (C) Fluorescent cells in the pancreas (arrow) after injection of elements 7 and 8. |
|
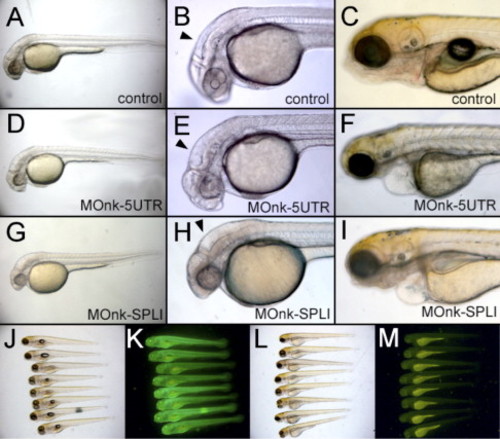
Morphant zebrafish after the injection of either MOnk-5UTR or MOnk-SPLI. (A, B, D, E, G, H) Embryos at 32 hpf. (C, F, I, J–M) 4-day-old larvae. The morphant embryos have an enlarged brain ventricle (arrowhead) (E, H) compared to control embryos (B). (J–M) Injection of nkx2.2a(52UTR):GFP mRNA alone (J, K) or together (L, M) with MOnk-5UTR. Fluorescence is markedly reduced in (M) compared to (K). PHENOTYPE:
|

Unillustrated author statements PHENOTYPE:
|
Reprinted from Developmental Biology, 304(2), Pauls, S., Zecchin, E., Tiso, N., Bortolussi, M., and Argenton, F., Function and regulation of zebrafish nkx2.2a during development of pancreatic islet and ducts, 875-890, Copyright (2007) with permission from Elsevier. Full text @ Dev. Biol.

