
- Title
-
alphaII-Spectrin Is Essential for Assembly of the Nodes of Ranvier in Myelinated Axons
- Authors
- Voas, M.G., Lyons, D.A., Naylor, S.G., Arana, N., Rasband, M.N., and Talbot, W.S.
- Source
- Full text @ Curr. Biol.
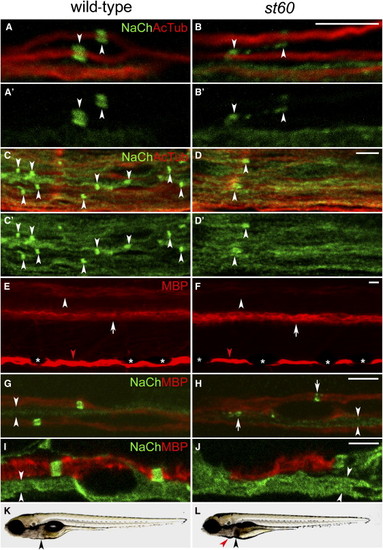
The Nodes of Ranvier Are Abnormal in st60 Mutants (A–B) PLLn of the wild-type (A) and st60 (B) 5 dpf larvae labeled with anti-panNavCh (NaCh) and anti-acetylated tubulin (AcTub). Sodium-channel clusters (indicated by arrowheads) have a distinct morphology in the wild-type (A and A2) but are abnormal in st60 mutants (B and B2). (C–D) Spinal cords of 5 dpf larvae. Sodium-channel clusters (indicated by arrowheads) are more numerous and more regularly shaped in the wild-type (C and C2) than in st60 mutants (D and D2). (E and F) Lateral view of 5 dpf larvae labeled with anti-MBP. Wild-type larvae (E) have myelinated axons in a dorsal region (indicated by arrowhead) and a ventral region (indicated by arrow) of the spinal cord. st60 mutants (F) express a reduced amount of MBP in the dorsal region (indicated by arrowhead), but the ventral region is normal (indicated by arrow). MBP expression in the PLLn is similar in the wild-type and mutant ([E] and [F], indicated by red arrowheads). Visualization of MBP in the PLLn is periodically interrupted by pigment-producing melanophores in both the wild-type and mutants ([E] and [F], indicated by asterisks). (G and H) PLLn of 5 dpf larvae labeled with anti-panNavCh and anti-MBP. Sodium-channel clusters form in the myelinated axons of both the wild-type and mutants, but they are abnormally shaped in st60 mutants ([H], indicated by arrows). Unmyelinated axons have diffuse sodium-channel expression in both the wild-type and mutants ([G] and [H], indicated by arrowheads). (I and J) Motor nerves in 5 dpf larvae labeled with anti-panNavCh and anti-MBP. Mutant motor nerves usually lack MBP, but some have a short region of MBP expression (J) that lacks sodium-channel immunoreactivity. Unmyelinated axons have diffuse sodium-channel expression ([I] and [J], indicated by arrowheads). (K and L) Imaging of live 5 dpf larvae shows that st60 mutants have necrosis in the liver ([K] and [L], indicated by black arrowheads), mild pericardial edema ([L], indicated by red arrowhead), and a failure to inflate the swimbladder. All scale bars represent 5 μm. |
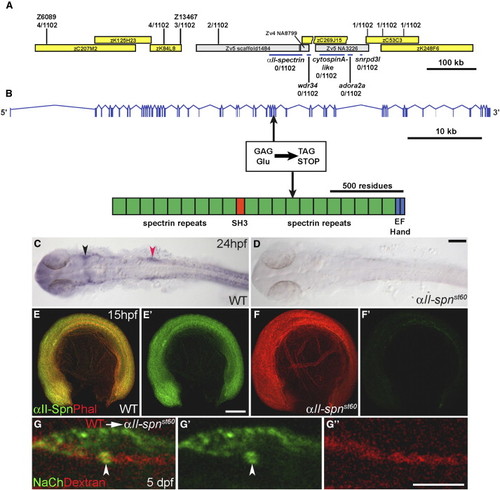
The st60 Mutation Disrupts the αII-spectrin Gene, which Is Required Autonomously in Neurons for Sodium-Channel Clustering (A) Positions of genetic markers along LG21 are shown with the number of recombinations out of 1102 meioses. BACs are indicated by yellow boxes. The st60 mutation maps to a gap in the finished genomic sequence. A rough contig in the gap was built by alignment of sequences from various sources, including genomic scaffold sequence (gray boxes, www.ensembl.org), BACs, and cDNAs. Linkage to st60 was tested for five genes in the gap (indicated by blue bars). (B) The intron-exon structure of αII-spectrin was determined by comparison of cDNA (GenBank accession number EF375552) and genomic sequences. The domain structure of the αII-spectrin polypeptide is also shown. Sequencing of the exons revealed a nonsense mutation in exon 33, which truncates the ORF at amino acid 1491. (C and D) RNA in situ hybridization detecting αII-spn transcripts in the wild-type (C) and αII-spnst60 mutant zebrafish (D) at 24 hpf (dorsal view with anterior left). In the wild-type, expression of αII-spn is widespread and especially prominent in the brain, eyes, and cranial ganglia. Arrowheads mark the region of trigeminal (shown in black) and PLL (shown in red) ganglia. Expression of αII-spn is greatly reduced in αII-spnst60 mutants. The scale bar represents 100 μm. (E–F) Wild-type (E) and αII-spnst60 mutant (F) embryos (anterior left, dorsal up) labeled with phalloidin (phal) and anti-αII-spectrin at 15 hpf. (E2) and (F2) show anti-αII-spectrin labeling alone. Expression of αII-spectrin is ubiquitous in wild-type, whereas expression is nearly abolished in αII-spnst60 mutants. The scale bar represents 100 μm. (G, G2, and G22) Chimeric larvae generated by transplantation of fluorescently labeled wild-type cells into αII-spnst60 mutants were analyzed for the ability to form sodium-channel clusters with the panNavCh antibody. A representative chimera is shown in (G) in which a single wild-type axon from the PLLn is labeled with the lineage marker (red dextran in [G] and [G22]) and has a morphologically normal sodium-channel cluster (indicated by arrowhead, shown in green in [G] and [G2]). The scale bar represents 5 μm. EXPRESSION / LABELING:
|
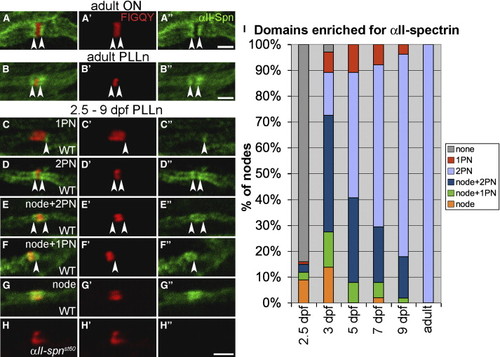
Localization of αII-Spectrin in Myelinated Axons (A–B) Adult optic nerve (A) and PLLn (B) labeled with anti-αII-spectrin. Nodes are labeled with anti-FIGQY [6]. The anti-αII-spectrin labeling alone is shown in (A22) and (B22). Expression of αII-spectrin is enriched in the paranodes (indicated by arrowheads). (C–G) Nodes from the PLLn of 2.5–9 dpf embryos and larvae labeled with anti-FIGQY and anti-αII-spectrin. The anti-αII-spectrin labeling alone is shown in (C22)–(G22). At these stages, αII-spectrin is enriched in various combinations of nodes and paranodes. Arrowheads indicate αII-spectrin enrichment in paranodes (PN). (H) No αII-spectrin labeling was detected in αII-spnst60 mutants. (I) A histogram indicating percentages of PLLn nodes with different αII-spectrin localization patterns at 2.5 dpf (101 nodes from 6 embryos), 3 dpf (102 nodes from 16 embryos), 5 dpf (101 nodes from 13 larvae), 7 dpf (104 nodes from 17 larvae), 9 dpf (106 nodes from 18 larvae), and adult stage (94 nodes from 3 adults). A node or paranode was considered enriched if its anti-αII-spectrin labeling was appreciably greater than the neighboring internodes. All scale bars represent 2 μm. |
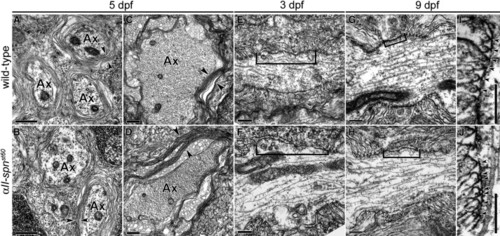
Ultrastructural Analysis of the Node of Ranvier in αII-spectrinst60 Mutants (A–D) TEM images of the PLLn (A and B) and Mauthner axons of the ventral spinal cord (C and D) in transverse sections of 5 dpf larvae. Arrowheads indicate multiple layers of myelin present in both the wild-type (A and C) and αII-spnst60 mutants ([B] and [D]; Ax = myelinated axon). For both the wild-type and mutants, the PLL nerves and spinal cords of at least six individuals were examined. Scale bars represent 0.5 μm. (E and F) TEM images of nodes of Ranvier in longitudinal sections from the PLLn at 3 dpf. On average, the nodal gap between paranodes (indicated here with brackets) is slightly longer in αII-spnst60 mutants (F) than in the wild-type at this stage (E). (G and H) Nodes of Ranvier from the PLLn at 9 dpf. At this stage, the average nodal gap in αII-spnst60 mutants (H) is significantly longer than that seen in wild-type nodes (G). (I and J) Paranodes from longitudinal sections of the PLLn at 9 dpf. Morphology of the paranodal loops and transverse bands (indicated by arrowheads) are comparable between wild-type and mutant nodes. Scale bars for (E)–(J) represent 0.2 μm. |
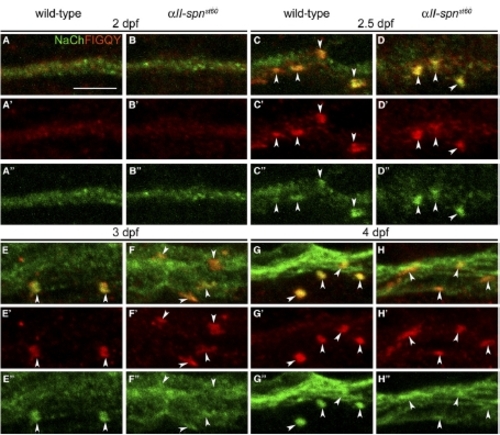
The αII-spectrinst60 Node Defect Is Evident Soon after Sodium-Channel Clusters Form. PLLn nodes from wild-type and αII-spnst60 embryos labeled with anti-panNavCh and anti-FIGQY (which labels nodal Neurofascin) at 2, 2.5, 3, and 4 dpf. (A′)–(H′) show anti-FIGQY alone, and (A″)–(H″) show anti-panNavCh alone. (A–B) At 2 dpf, the PLLn is diffusely labeled with both antibodies. The scale bar represents 5 μm. (C–D) At 2.5 dpf, sodium-channel and Neurofascin clusters are present and colocalize. The cluster morphology is immature, and there is no obvious difference between the wild-type (C) and mutant (D). (E–F) By 3 dpf, most of the wild-type sodium-channel and Neurofascin clusters have acquired mature node morphology (E). Many clusters in mutants have not achieved mature morphology (F). (G–H) At 4 dpf, sodium-channel and Neurofascin cluster morphology remains abnormal in the mutants (H). |
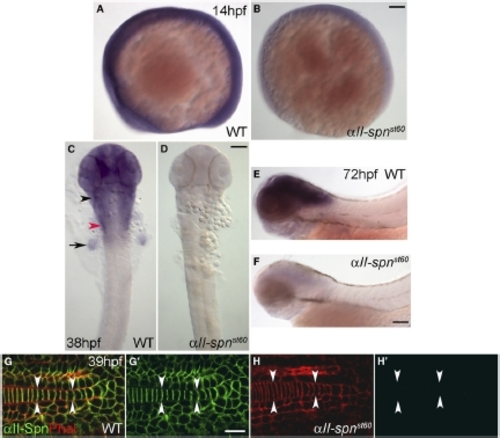
Expression of αII-spectrin mRNA and Protein during Development (A–F) RNA in situ hybridization detecting αII-spn transcripts in the wild-type (A, C, and E) and αII-spnst60 mutant zebrafish (B, D, and F) at 14 hpf (A and B), 38 hpf (C and D), and 72 hpf (E and F). (A), (B), (E), and (F) show lateral views with anterior left and dorsal up. (C) and (D) show dorsal views with anterior up. In the wild-type, expression of αII-spn is initially ubiquitous (A) but later becomes especially prominent in the brain, eyes, and cranial ganglia (C and E). The black arrowhead in (C) indicates the region of the anterior lateral line and trigeminal ganglia, whereas the red arrowhead indicates the region of the PLL ganglion and the arrow points to the fin bud. Expression of αII-spn is greatly reduced in αII-spnst60 mutants as early as 14 hpf (B) and is almost completely absent in later stages (D and F). Scale bars represent 100 μm. (G–H) High magnification views of embryonic tails (anterior left, dorsal up, arrowheads indicate the notochord) labeled with phalloidin (red) and anti-αII-spectrin (green) at 39 hpf. (G0) and (H0) show anti-αII-spectrin labeling alone. In the wild-type, αII-spectrin is closely associated with the plasma membrane (colocalization with phalloidin in [G]), although expression of αII-spectrin in αII-spnst60 mutants is not detectable at this stage (H′). The scale bar represents 10 μm. EXPRESSION / LABELING:
|
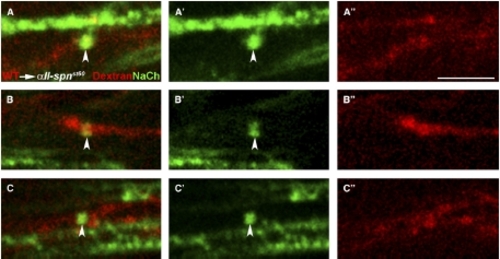
Sodium-Channel Clustering Requires αII-spectrin Function Autonomously in Neurons Chimeric larvae generated by transplantation of fluorescently labeled wild-type cells into αII-spnst60 mutants were analyzed for the ability to form sodium-channel clusters with the panNavCh antibody. Sodium-channel expression (A′–C′), dextran-dye-labeled axons (A″–C″), and merged images (A–C) are shown from the PLLn of three different chimeras. In these examples, all of the dye-labeled cells are neurons and normal sodium-channel clusters (indicated by arrowheads) are only evident in dye-labeled wild-type axons. Unmyelinated axons, which have sodium-channel proteins throughout the axolemma, can also be seen (e.g., in [A]). The genotype of mutant hosts was confirmed by PCR. The scale bar represents 5 μm. |
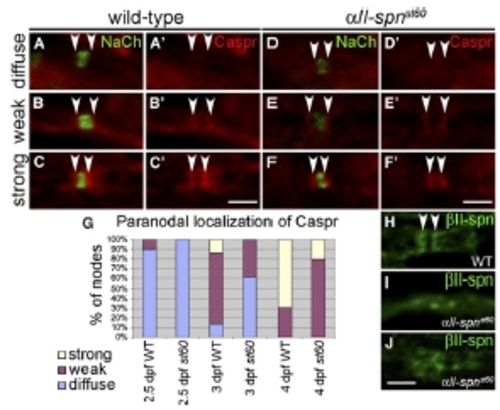
Expression of Paranodal Markers in αII-spectrin Mutants (A–F) PLLn nodes from embryos labeled with anti-panNavCh and anti-Caspr. Anti-Caspr labeling alone is shown in (A′)–(F′). Localization of Caspr to paranodes (indicated by arrowheads) was either diffuse (A and D), weak (B and E) or strong (C and F) in both the wild-type (A–C) and αII-spnst60 mutants (D–F). (G) A histogram showing the proportion of nodes with diffuse, weak, or strong paranodal localization of Caspr at 2.5 dpf (177 nodes from 18 WT embryos and 72 nodes from eight st60 embryos), 3 dpf (102 nodes from eight WT embryos and 105 nodes from five st60 embryos) and 4 dpf (104 nodes from four WT embryos and 98 nodes from four st60 embryos). The accumulation of Caspr at the paranodes in aII-spnst60 mutants lags behind that in the wild-type at each stage. (H–J) PLLn nodes from 5 dpf larvae labeled with anti-βII-spectrin. Anti-βII-spectrin clearly labels paranodes in the wild-type (indicated by arrowheads in [H]), whereas in αII-spnst60 mutants, localization of βII-spectrin is less distinct (I and J). Scale bars represent 2 μm. |

Unillustrated author statements PHENOTYPE:
|