
- Title
-
Rapid three-dimensional imaging and analysis of the beating embryonic heart reveals functional changes during development
- Authors
- Liebling, M., Forouhar, A.S., Wolleschensky, R., Zimmermann, B., Ankerhold, R., Fraser, S.E., Gharib, M., and Dickinson, M.E.
- Source
- Full text @ Dev. Dyn.
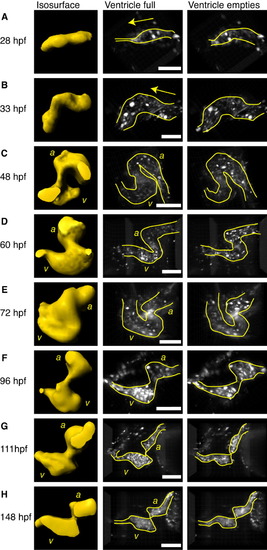
Dynamic three-dimensional (3D) reconstruction of the developing Tg(gata1:GFP) zebrafish heart at various stages. Left column corresponds to isosurface renderings obtained during mid-diastole. Central column: 3D volume renderings (maximum intensity projection) when the ventricle is full. Right column: 3D volume renderings when the ventricle empties. a, atrium; v, ventricle. Arrows indicate flow direction. Scale bars = 100 μm. |
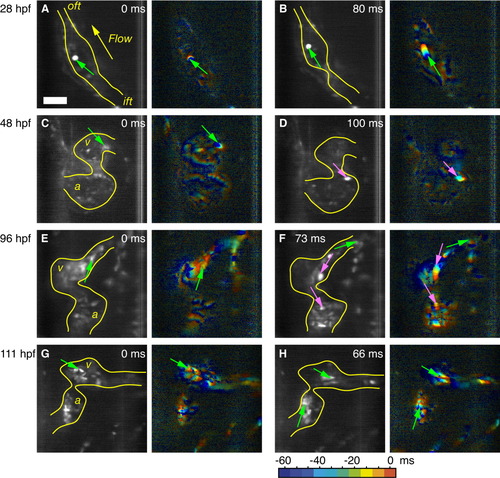
Dynamic slice sequence (sections) of the developing Tg(gata1:GFP) zebrafish heart. A-H: Grayscale images correspond to still frames, color images were obtained by superimposing 10 frames of the image sequence. Each color corresponds to one time point. The first frame is assigned blue, the last frame, which corresponds to the still frame, red. A,C,E,G: Beginning of ventricle contraction. The flow is in the forward direction as can be seen from the direction of the blue to red streaks left by the red blood cells (indicated by green arrows). B,F: At a later time-point in the cardiac cycle, the flow is still uniquely forward at 28 hours postfertilization (hpf) and 111 hpf. D,H: At 48 hpf and 96 hpf, retrograde flow is visible, exhibited by the streaks in backward direction (indicated by pink arrows). Scale bar = 50 μm. a, atrium; v, ventricle; ift, inflow tract; oft, outflow tract. |
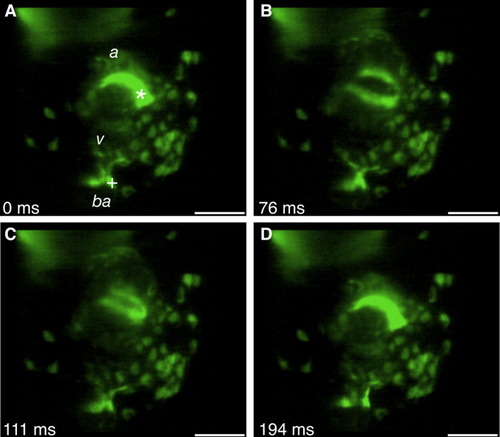
Cardiac cushion dynamics during heart contraction. A-D: Single images produced from a four-dimensional reconstruction of the actively contracting 72 hours postfertilization (hpf) Tg(tie2:GFP)-expressing heart. The valve cushions between the atrium (a) and the ventricle (v) and the ventricle and the bulbus arteriosis (ba) are marked with an asterisk and plus sign, respectively. GFP, green fluorescent protein. Scale bar = 50 μm. |
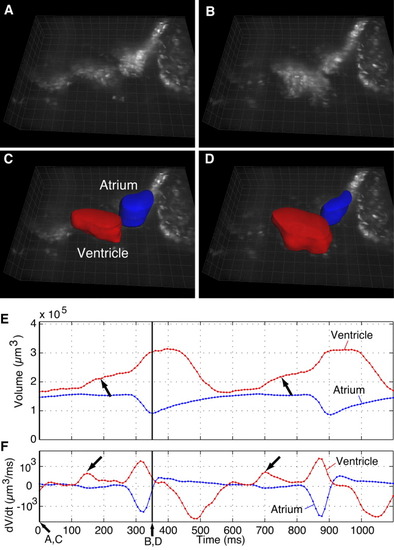
A-D: Three-dimensional renderings of 148 hours postfertilization (hpf) Tg (gata1:GFP) zebrafish heart at systole (A,C) and diastole (B,D). C,D: The atrium (blue) and the ventricle (red) have been segmented. E: Volume change over two cycles. F: Derivative of volume with respect to time over two cycles. Two phases of ventricle filling precede blood ejection from the ventricle. The first phase occurs before atrial ejection, and the second is coincident with atrial ejection. Arrows indicate passive filling of the ventricle. GFP, green fluorescent protein. Grid spacing = 20 μm. |