
- Title
-
Dynamic expression patterns of zebrafish 1G5 (1G5z), a calmodulin kinase-like gene in the developing nervous system
- Authors
- Won, M., Ro, H., Park, H.C., Kim, K.E., Huh, T.L., Kim, C.H., and Rhee, M.
- Source
- Full text @ Dev. Dyn.
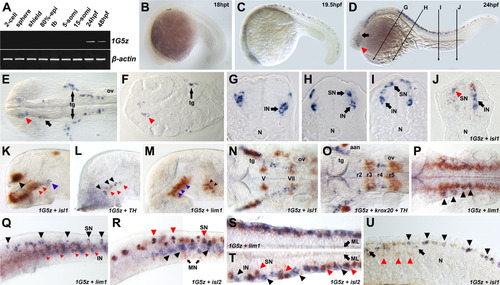
Spatiotemporal distribution of 1G5z during early embryogenesis. A: 1G5z expression levels in the embryos at various developmental stages were analyzed using reverse transcriptase-polymerase chain reaction (RT-PCR). A β-actin-specific primer set was used to generate internal control for the RT-PCR. B: At the 18 hours postfertilization (hpf) stage, lateral view. C: The 20-somite stage, lateral view. Note that the first 1G5z transcripts appeared at this stage. D: At 24 hpf, lateral view. Diagram showing the plane of cryostat section (10 μm) in G, H, I, and J. E: Highly magnified dorsal view of brain region of D. Before taking pictures, the embryos were flat-mounted. The red arrowhead and arrow indicate the anterior-ventral diencephalon and the tegmentum, respectively. F: Horizontal section of E. The red arrowhead indicates the restricted expression pattern of 1G5z in the diencephalon. G-I: 1G5z mRNAs are detected in interneuron and sensory neuron. J: Two-color whole-mount in situ hybridization (WISH) with isl1 (orange color) shows interneuron- and sensory neuron-specific expression of 1G5z (blue color) in the medial spinal cord. The red arrowhead indicates overlapping expression of 1G5z and isl1 in the sensory neuron. The black arrow indicates interneuron expression of 1G5z. K-U: Bicolor WISH with isl1(K,N,U), th (L), lim1 (M,Q,S) isl2 (R,T) th plus krox20 (O) in orange (INT-BCIP substrate) and 1G5z in blue (NBT-BCIP substrate) was performed. K-M: Lateral view of the forebrain. K: 1G5z and isl1 are colocalized in the telencephalon (black arrowhead) but partly overlap in the diencephalon (red arrow). Note that the blue arrowhead indicates a nonoverlapping region. L: 1G5z-expressing neural cell clusters (black arrowhead) are not colocalized with th-positive cells (red arrowhead). M: lim1-expressing domains in the diencephalon (blue arrow) and mesencephalon (black arrow) encompass 1G5z-positive neural cell clusters. N-P: Dorsal view of the hindbrain. N: 1G5z and isl1 are colocalized in the trigeminal ganglion (tg). O: 1G5z and krox20 are colocalized in the rhombomere3 (r3). P: lim1 expression domain completely encompasses 1G5z expressing hindbrain cells. Q-T: Anterior trunk spinal cord. Q,R,U: Lateral view of trunk spinal cord. Q: 1G5z and lim1 are colocalized in the interneurons (red arrowhead) but not in the sensory neurons (black arrowhead). S: Dorsal view of Q. R: 1G5z and isl2 are colocalized in the sensory neurons (red arrowhead) but not in the interneurons (1G5z-specific expression; black arrowhead) and motoneurons (isl2-specific expression; black arrow). T: Dorsal view of R. U: In the medial-caudal trunk region, 1G5z and isl1 are colocalized in the sensory neurons (black arrowheads) but not in the interneurons (black arrows). Red arrowheads indicate motor neurons in which isl1 is exclusively detected. The anterior part of all embryos is oriented to the left. aan, arch-associated neuron; epi, epiboly; IN, interneuron; ML, midline; MN, motor neuron (motoneuron); N, notochord; ov, otic vesicle; r, rhombomere; SN, sensory neuron; tb, tail bud; tg, trigeminal ganglion; V, fifth cranial nerve; VII, seventh cranial nerve. |
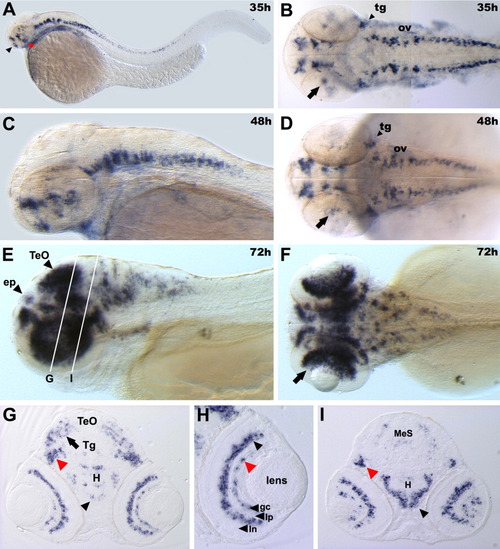
Distribution of 1G5z transcripts during late embryogenesis. A: At 35 hours postfertilization (hpf). Lateral view. The red arrowhead indicates the hypothalamus; and black arrowhead indicates the telencephalon. B: Dorsal view of the brain domain of A. The arrow indicates new messages in the retina. C: At 48 hpf. Lateral view. D: At 48 hpf. Dorsal view. E: At 72 hpf. Lateral view. F: At 72 hpf. Dorsal view. G-I: Transverse section of the brain along the white lines in E. G,I: 1G5z-expressing cells are detected in the optic tectum (black arrow), lateral part of tegmentum (G, I, red arrowhead), and hypothalamus (G, I, black arrowhead). H: High-magnification view of the eye of G. 1G5z transcripts are detected in the proximal part of the inner nuclear layer (black arrow) and some ganglion cells (red arrowhead). Anterior part of all embryos is oriented to the left. ep, epiphysis; gc, ganglion cell layer; H, hypothalamus; In, inner nuclear layer; Ip, inner plexiform layer; MeS, mesencephalon; ov, otic vesicle; Tg, tegmentum; tg, trigeminal ganglion. EXPRESSION / LABELING:
|
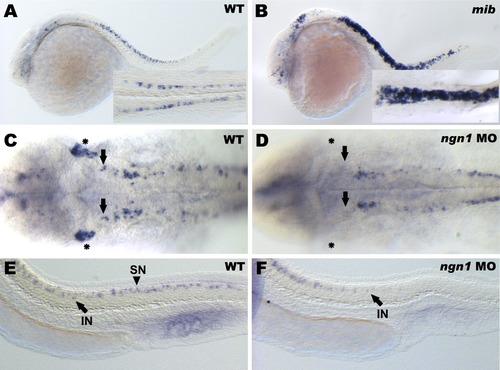
Aberrant neuronal cell development in the absence of Delta-Notch signaling, or Ngn1. A: At 24 hours postfertilization (hpf), lateral view of wild-type embryo. Inset: High-magnification dorsal view of the spinal cord. B: 1G5z expression pattern in mibta52b mutant. Inset: High-magnification dorsal view of the spinal cord. C-F: At the 24 hpf. C: Dorsal view of uninjected control embryo. 1G5z transcripts are detected in trigeminal ganglion (asterisk) and anterior hindbrain (arrow). D: ngn1 mopholino (MO) -injected embryo. Note the complete lack of 1G5z expression in the trigeminal ganglion (asterisk) and anterior hindbrain (arrow). E,F: Lateral view of medial-caudal trunk of the same embryos of C and D. Note that ngn1 MO injection abolished 1G5z expression in the posterior sensory neuronal cells (arrowhead). Arrows indicate interneurons. IN, interneuron; SN, sensory neuron. EXPRESSION / LABELING:
|
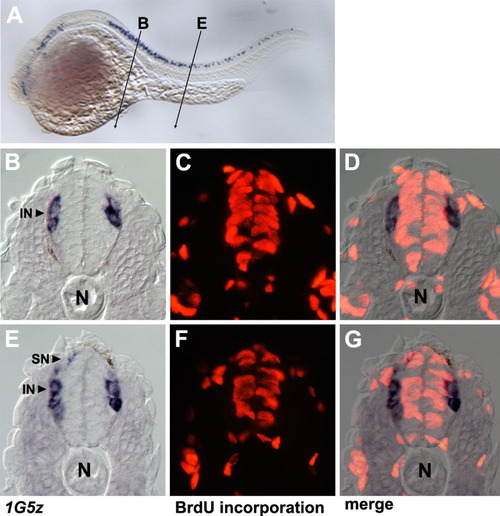
1G5z-expressing cells are postmitotic neurons. A: Diagram showing the plane of transverse sections (10 μm) in B-D and E-G. B: 1G5z-positive cells in the anterior spinal cord. C: Embryonic tissue in A incubated with bromodeoxyuridine (BrdU). D: Merged image of B and C. Note that 1G5z-stained cells are negative for BrdU staining. E: 1G5z-expressing cells in the medial trunk. F: Embryonic tissue in E treated with BrdU. G: Overlapping image of E and F. Note that 1G5z-positive cells avoid BrdU incorporation. The embryo is fixed at 24 hpf. IN, interneuron; N, notochord; SN, sensory neuron. EXPRESSION / LABELING:
|

Unillustrated author statements |