
- Title
-
Cloning and characterization of zebrafish CTCF: Developmental expression patterns, regulation of the promoter region, and evolutionary aspects of gene organization
- Authors
- Pugacheva, E.M., Kwon, Y.W., Hukriede, N.A., Pack, S., Flanagan, P.T., Ahn, J.C., Park, J.A., Choi, K.S., Kim, K.W., Loukinov, D., Dawid, I.B., and Lobanenkov, V.V.
- Source
- Full text @ Gene
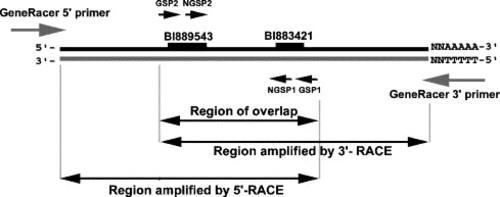
Diagram of zebrafish CTCF cloning. The SMART RACE Kit was used to amplify 5′ and 3′ cDNA fragments. BI889543 and BI883421 are the GenBank accession numbers of two zebrafish cDNA clones that had high homology to the mouse and human CTCF genes. Gene specific primers (GSP) for performing 5′ and 3′ RACE were based on these (BI889543 and BI883421) sequences. |
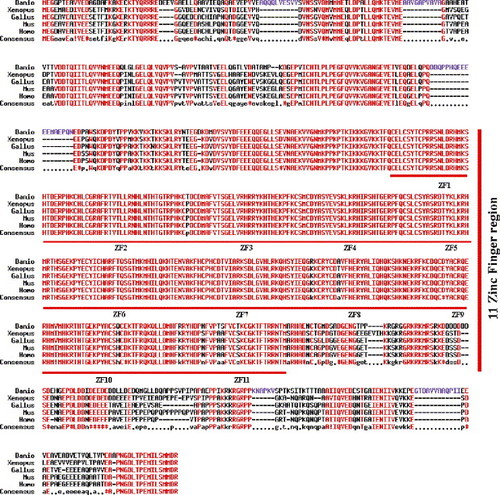
Multiple alignment of CTCF proteins. The amino acid sequences of zebrafish (Danio; GenBank accession No. AY547282), chicken (Gallus; GenBank accession no. Z22605), human (Homo; GenBank accession no. HSU25435), mouse (Mus; GenBank accession no. U51037) and Xenopus (Xenopus; GenBank accession no. AF305695) CTCF were aligned using the MultAlin computer program (http://prodes.toulouse.inra.fr/multalin/multalin.html). Identical amino acids are marked in red. Dashes indicate absence of alignment. The unique zebrafish amino acid regions are marked in purple. |
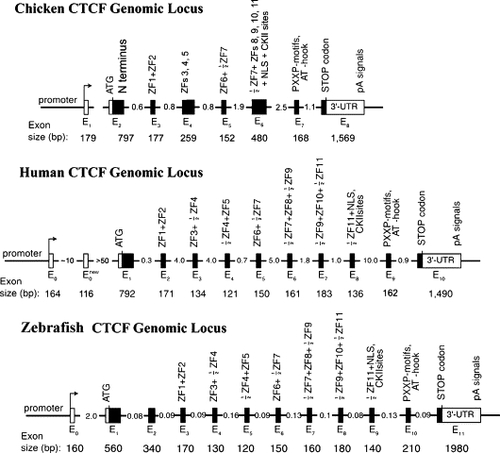
Genomic organization of the chicken, human and zebrafish CTCF genes. Filled boxes, protein coding exons; open boxes, untranslated exons; arrows, transcription start sites. The numbers indicate the estimated sizes of exons and introns in kilobases. The eleven zinc fingers of mammalian CTCF are distributed in exons E2 to E8, with several ZFs being split across neighboring exons. Structure of the avian and human CTCF genes is shown according to Ohlsson et al. (2001) |
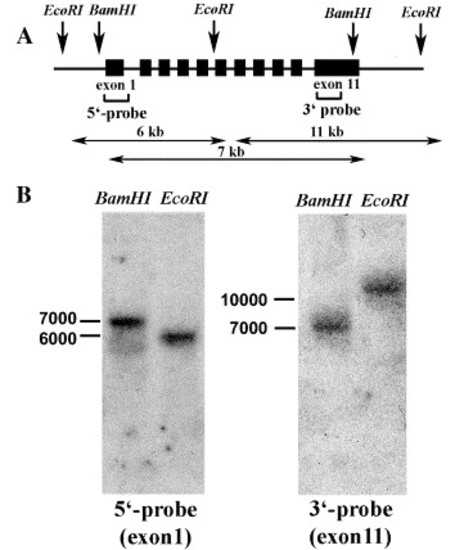
Southern blot analysis of the CTCF gene in zebrafish genomic DNA. (A) Schematic restriction map of the zebrafish CTCF gene showing enzymes used for Southern blot analysis, size of expected fragments and the respective probes. (B) Genomic DNA digested with EcoRI or BamHI restriction enzyme was electrophoresed and hybridized with labeled CTCF fragments representing exon1 and part of exon 11. Molecular weight markers are shown on the left of the panel. |
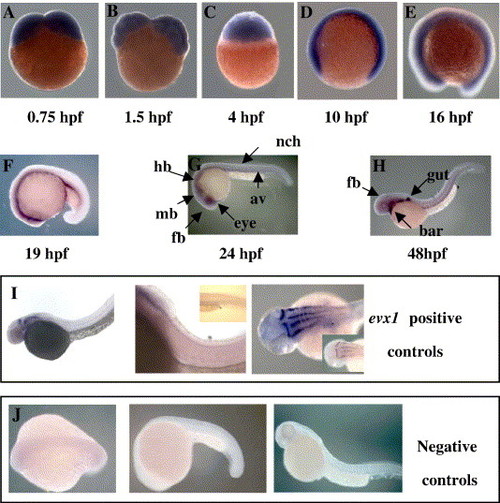
Developmental expression pattern of zebrafish CTCF gene. Distribution of the CTCF message was analyzed at different developmental stages from 0.75 to 48 hpf (panels from A to H, respectively). At early stages, expression of CTCF is ubiquitous (A–E), becoming more restricted to the brain by late embryogenesis (F–H). Late embryos show CTCF transcript mostly in the gut (Fig. 6, panel H). As positive controls, evx1 transcript yielded a pattern similar to that reported at ZFIN (http://zfin.org; ZFIN ID: ZDB-XPAT-021126-6) (panel I). Negative control for in situ hybridization staining by sense CTCF exon 1 probe (panel J). Abbreviations: av, axial vessel; bar, brachial arches; fb, forebrain; hb, hindbrain; mb, midbrain; nch, notochord. |
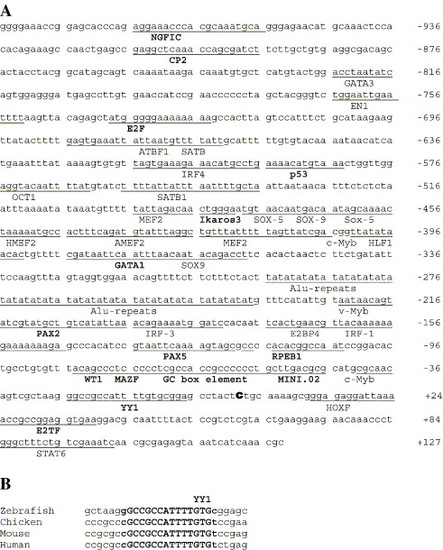
CTCF promoter sequence analyses. (A) Nucleotide sequence of the 5′-flanking region of the CTCF gene. The transcription initiation site is shown as bold c. Potential transcription factor binding sites, revealed by MatInspector computer program (http://www.genomatix.de/index.html), are underlined; conserved sites in zebrafish, mouse and human are marked in bold. (B) Phylogenetic conservation of YY1 element in zebrafish, chicken, mouse and human. The binding site for YY1 factor marked by capital bold letters. |
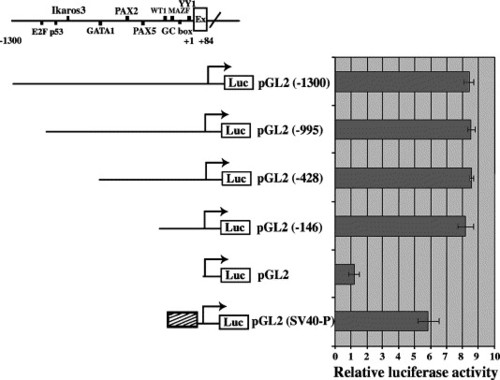
Functional analysis of CTCF gene promoter region. (A) 1.4-kb genomic DNA fragment covering the 5′ flanking region (- 1300) plus a region of exon 1 (+ 84 bp) with putative conserved transcription factor binding sites. CTCF promoter constructs: promoter-less vector plasmid (pGL2), promoter region from - 146 to + 84 (pGL2 (- 146)), promoter region from - 428 to + 84 (pGL2 (- 428)), promoter region from - 995 to + 84 (pGL2 (- 995)), and promoter region from - 1300 to + 84 (pGL2 (- 1300)) are illustrated at the left. PGL2 plasmid with SV40 enhancer and promoter (pGL2 (SV40-P)) was used as positive control. Luciferase assays were repeated in three independent experiments. |
Reprinted from Gene, 375, Pugacheva, E.M., Kwon, Y.W., Hukriede, N.A., Pack, S., Flanagan, P.T., Ahn, J.C., Park, J.A., Choi, K.S., Kim, K.W., Loukinov, D., Dawid, I.B., and Lobanenkov, V.V., Cloning and characterization of zebrafish CTCF: Developmental expression patterns, regulation of the promoter region, and evolutionary aspects of gene organization, 26-36, Copyright (2006) with permission from Elsevier. Full text @ Gene