
- Title
-
Reverse genetic analysis of neurogenesis in the zebrafish retina
- Authors
- Pujic, Z., Omori, Y., Tsujikawa, M., Thisse, B., Thisse, C., and Malicki, J.
- Source
- Full text @ Dev. Biol.
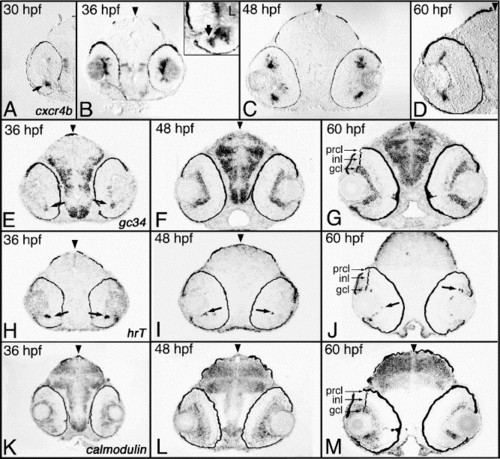
Transcripts predominantly expressed in the GCL. Shown are examples of cDNAs expressed in the ganglion cell layer. (A–D) Expression of cxcr4b between 30 and 60 hpf. (E–G) Expression of the gc34 gene between 36 and 60 hpf. (H–J) Expression of hrT between 36 and 60 hpf. (K–M) Expression of the calmodulin gene between 36 and 60 hpf. Expression was studied on plastic sections following whole-embryo in situ hybridization. Arrowheads mark the midline. Arrows indicate individual cells or small groups of cells that feature expression of particular transcripts. hpf, hours postfertilization; prcl, photoreceptor cell layer; inl, inner nuclear layer; gcl, ganglion cell layer. |
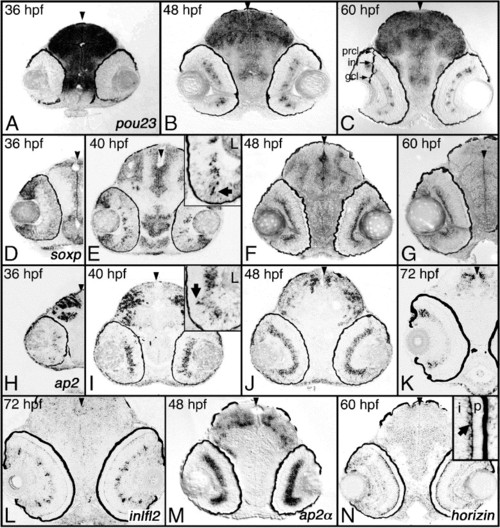
Transcripts predominantly expressed in the INL. Shown are examples of cDNAs expressed in the inner nuclear layer. (A–C) Expression of pou23 between 36 and 60 hpf. (D–G) Expression of soxp between 36 and 60 hpf. (H–K) Expression of ap2β between 36 and 72 hpf. (L) Expression of inlf12 at 72 hpf. (M) Expression of ap2α at 48 hpf. (N) Expression of horizin at 60 hpf. Expression was studied on plastic sections following whole-embryo in situ hybridization. Arrowheads indicate the midline. hpf, hs postfertilization; prcl, photoreceptor cell layer; inl, inner nuclear layer; gcl, ganglion cell layer. EXPRESSION / LABELING:
|
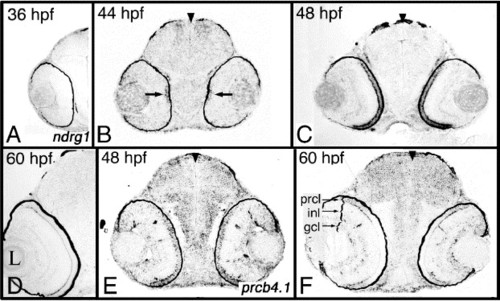
Transcripts predominantly expressed in the photoreceptor cell layer. (A–D) Expression of ndrg1 between 36 and 60 hpf. (E–F) Expression of prcb4.1 at 48 and 60 hpf. Expression was studied on plastic sections following whole-embryo in situ hybridization. Arrowheads mark the midline. hpf, hours postfertilization; prcl, photoreceptor cell layer; inl, inner nuclear layer; gcl, ganglion cell layer. |
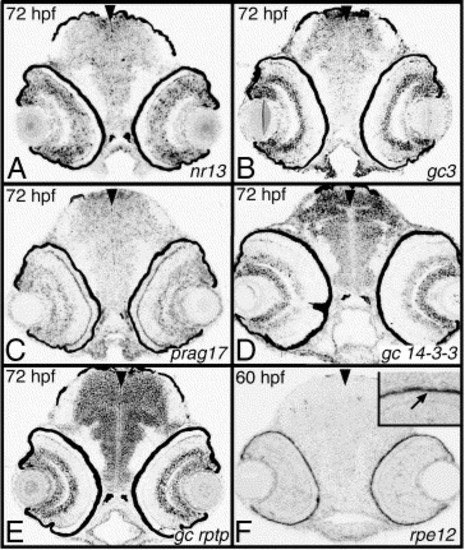
Transcripts expressed in multiple cell layers or RPE. (A) nr13 is expressed in all layers with exception of photoreceptor cells. (B) gc3 expression is mostly detectable in the inner nuclear layer and in ganglion cells. (C) prag17 transcript is enriched in the vicinity of the outer plexiform layer and in the inner retina. (D) gc 14-3-3 is expressed in the ganglion cell layer and in amacrine cells at a somewhat lower level. (E) gc rptp is expressed at approximately the same level in both GCL and the inner portion of INL, most likely in amacrine cells. (F) rpe12 is expressed in the retinal pigment epithelium. The expression pattern of each clone is shown at one time point, indicated in the upper left corner of each panel. Transcripts were analyzed on plastic sections following whole-embryo in situ hybridization. To block RPE pigmentation, embryo in panel F was treated with PTU. Arrowheads mark the midline. hpf, hours postfertilization; prcl, photoreceptor cell layer; inl, inner nuclear layer; gcl, ganglion cell layer. EXPRESSION / LABELING:
|
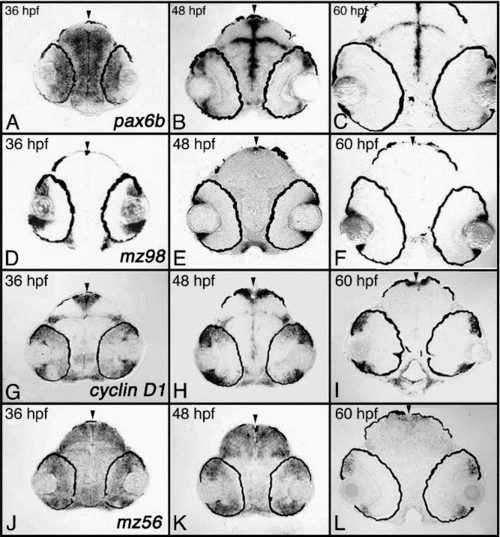
Marginal zone expression. Shown are examples of transcripts expressed at the marginal zone. (A–C) pax6b, (D–F) mz98, (G–I) cyclin D1, (J–L) mz56. Transcripts were analyzed on plastic sections following whole-embryo in situ hybridization. Arrowheads mark the midline. hpf, hours postfertilization. |
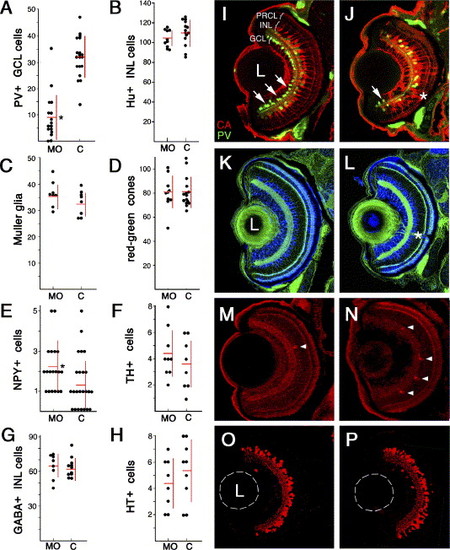
Cell fate analysis in the retinae of soxp knockdown animals. In panels A through H, counts were performed on frozen sections following the injection of an anti-soxp morpholino or a control morpholino. (A) Parvalbumin-positive GCL cells in the soxp knockdown and control retinae. Following morpholino treatment, the numbers of parvalbumin-positive GCL cells are reduced from 32 ± 8 cells per section to 9 ± 9 cells (mean ± SD; P < 0.001 t test). (B) HuC/HuD-positive amacrine cells. (C) Muller glia visualized with anti-carbonic anhydrase antibody. (D) Zpr1-positive red-green double cones. (E) NPY-positive amacrine cells. Following anti-soxp morpholino treatment, the numbers of NPY-positive amacrine cells are increased from to 1.3 ± 1.1 to 2.2 ± 1.2 per retinal section (mean ± SD; P < 0.05 Whitney–Mann test). (F) Tyrosine hydroxylase-positive interplexiform cells. (G) GABA-positive anacrine cells. (H) Serotonin-positive amacrine cells. (I, J) Antibody staining of parvalbumin-positive cells (green) and carbonic anhydrase-positive Müller glia (red) in soxp knockdown (J) and control knockdown retinae (I). (K, L) Staining of ganglion and amacrine cells with an anti-Hu antibody and of red-green cones with the Zpr-1 antibody (both blue) in control knockdown (K) and soxp knockdown (L) retinae. In both panels, sections are counterstained with phalloidin to visualize plexiform layers (green). (M, N) Staining of NPY-positive cells in soxp knockdown (N) and control knockdown retinae (M). Photoreceptor cell layer staining with the zpr-1 antibody is provided as a control (also in red). (O, P) Staining with anti-GABA antibodies in soxp knockdown (P) and control knockdown (O) retinae. Arrows in panels I and J indicate parvalbumin-positive cells in the ganglion cell layer. Arrowheads in panels M and N indicate NPY-positive cells in the INL. Asterisks indicate the optic nerve. C, control knockdown; L, lens; MO, soxp knockdown. |
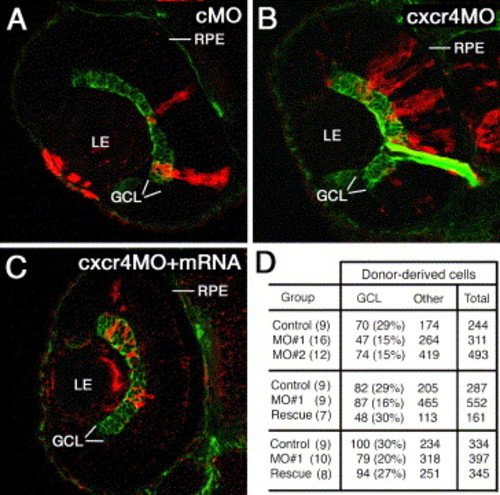
Mosaic analysis of cxcr4b knockdown phenotype. Blastomeres were transplanted into untreated host embryos from sibling donor embryos that were injected with a control MO (A) an anti-cxcr4b MO (B) or a mixture of anti-cxcr4b MO and crcr4b mRNA. The resulting mosaic retinae contain a mix of morpholino-treated donor-derived cells (red) and untreated host cells. The ganglion cell layer (GCL, green) is visualized with the Zn8 antibody. (D) The frequency of GCL cells in clones derived from donor animals treated with a control MO, anti-cxcr4b translation blocking MO (MO#1), anti-cxcr4b splice-site blocking MO (MO#2), or anti MO#1 and cxcr4b mRNA (Rescue). Each row of panel D table shows a separate experiment. In all experiments, morpholino injection resulted in a statistically significant loss of ganglion cells. mRNA treatment restores the wild-type frequency of ganglion cells. The numbers of retinae examined are provided in brackets. GCL, ganglion cell layer; LE, lens; RPE, retinal pigmented epithelium. |

Unillustrated author statements EXPRESSION / LABELING:
|
Reprinted from Developmental Biology, 293(2), Pujic, Z., Omori, Y., Tsujikawa, M., Thisse, B., Thisse, C., and Malicki, J., Reverse genetic analysis of neurogenesis in the zebrafish retina, 330-347, Copyright (2006) with permission from Elsevier. Full text @ Dev. Biol.