
- Title
-
The odorant receptor repertoire of teleost fish
- Authors
- Alioto, T.S., and Ngai, J.
- Source
- Full text @ BMC Genomics
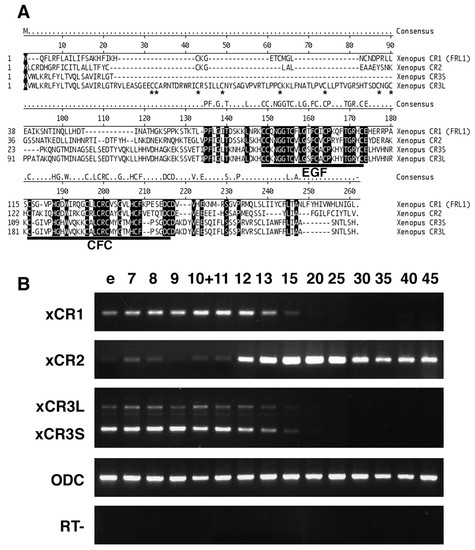
Comparison of amino acid sequences and temporal expression patterns of Xenopus EGF-CFC factors. (A) Comparison of the amino acid sequences of Xenopus EGF-CFC proteins (XCR1, XCR2, XCR3S and XCR3L). XCR3L has a 72 amino acid insertion following the signal sequence of XCR3S. Dash indicates no amino acid present. Identical residues are shadowed. Conserved EGF-like domains and CFC domains are underlined. Cysteine residues in the additional 72 amino acids of XCR3L are indicated by asterisks. (B) Temporal expression patterns of Xenopus EGF-CFC genes (XCR1, XCR2, XCR3S and XCR3L) detected by RT-PCR. RNA was extracted from embryos at the stages indicated over each lane. XCR3S (lower band) and XCR3L (upper band) were detected using a set of primers designed to span the insert region. Both bands showed a similar temporal expression pattern. e, un-fertilized egg; RT-, RT-PCR reaction without reverse transcriptase. |
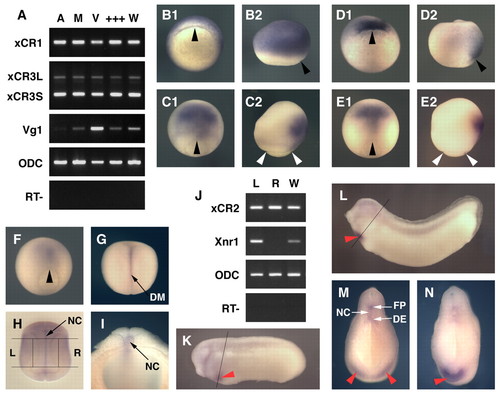
Spatial expression patterns of Xenopus EGF-CFC genes. (A) Spatial expression patterns of XCR1, XCR3S and XCR3L at stage 9, as determined by RT-PCR of the animal region (A), the marginal region (M), the vegetal region (V), a mixture of the dissected three parts (+++) and intact whole embryos (W). VG1 was used as a control for dissection. (B-I,K-N) Spatial expression analyses by in situ hybridization for XCR1 (FRL1; B,C), XCR3 (D,E) and XCR2 (F-I,K-N). (B1,D1) Stage 10+ in vegetal view. The dorsal side is up. (C1,E1,F,G) Stage 12 (C,E,F) and stage 15 (G) in dorsal view. The anterior side is up. (B2,C2,D2,E2) Stage 10+ (B,D) and stage 12 (C,E) in lateral view. The anterior side is up and the dorsal side is to the right. (H) Stage 20 in dorsal view. Embryo was cleared with benzyl benzoate/benzyl alcohol. Lines show the left (L) and right (R) dissection model for RT-PCR (J). (I) Transverse bisected embryo at stage 20. (J) RT-PCR of the left lateral region (L), the right lateral region (R) and intact whole embryos (W) at stage 20. XCR2 was expressed bilaterally, whereas XNR1 was expressed on only the left side. (K) Stage 25. Line indicates the section plane shown in M. (L) Stage 30. Line indicates the section plane in N. (M,N) Transverse cut embryos at stage 25 (M) and stage 30 (N). Red arrowheads indicate the expression of XCR2 in the prospective heart region; black arrowheads indicate the dorsal lip; white arrowheads indicate the blastopore. DE, dorsal endoderm; DM, dorsal midline; FP, floorplate; NC, notochord. |
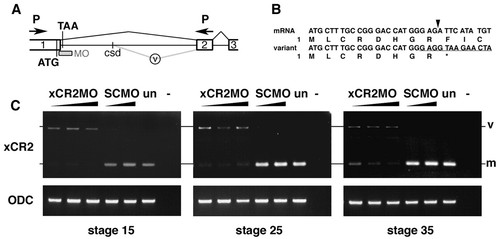
XCR2 MO blocks endogenous RNA splicing. (A) Genomic structure including exon I (1), exon II (2), and exon III (3) of XCR2. The translation initiation codon (ATG) and a potential termination codon (TAA) are indicated. The splice-site-targeted antisense morpholino oligonucleotide XCR2 MO (MO) was designed against the sequence at the boundary of exon I/intron I. Abnormal splicing detected in XCR2 MO-injected embryos is shown by the gray line (v). The spliced variant is generated by a cryptic splice donor (csd) site 642 bp downstream from the end of exon I. (B) Sequence comparison of cDNA from mature mRNA and the aberrant splicing variant. Amino acid sequences are also indicated. The variant generated by abnormal splicing has a termination codon (correspondent to TAA in Fig. 4A) right after the end of exon I. Arrowhead indicates the correct exon I/exon II splice junction. The target sequence of XCR2 MO is underlined. (C) RT-PCR analyses of XCR2 mRNA in XCR2 MO-injected embryos. Embryos were injected with 10, 20 and 50 ng of XCR2 MO, or 20 and 50 ng of Standard Control MO (SC MO), and harvested for RT-PCR at stage 15, 25 and 35. The primer set was designed to span the first intron to detect splicing of the endogenous XCR2 pre-mRNA. In XCR2 MO-injected embryos, the mature mRNA (m) was decreased and an abnormal splicing variant (v) was detected. At stage 35, the mature XCR2 mRNA was detectable at low levels in embryos injected with lowest dose (10 ng) of XCR2 MO. |
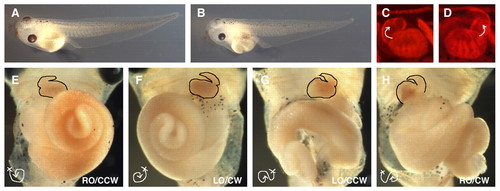
XCR2 MO disturbs randomization of left-right asymmetric patterning of the heart and gut in stage 45-46 embryos. (A) Embryo injected with 50 ng of a standard control MO (SC MO). (B) Embryo injected with 50 ng of XCR2 MO. (C-H) Embryos injected with MO into the marginal region of both blastomeres at the two-cell stage, immunostained with MF 20 antibody, and the signal detected by fluorescence (C,D) or DAB staining (E-H). (C,E) Embryo injected with 50 ng of SC MO, showing normal left-right asymmetric patterning of the heart (C,E) and gut (right origin and counterclockwise coil, RO/CCW) (E). (D,F-H) Embryos injected with 20 ng of XCR2 MO. (D) Reversed morphology of heart. (F) Embryo has a mirror-imaged heart and gut (the left origin and clockwise coil, LO/CW). (G) Embryo has a normal heart, and left origin and counterclockwise-coiled gut (LO/CCW). (H) Embryo has reversed heart, right origin and clockwise-coiled gut (RO/CW). |
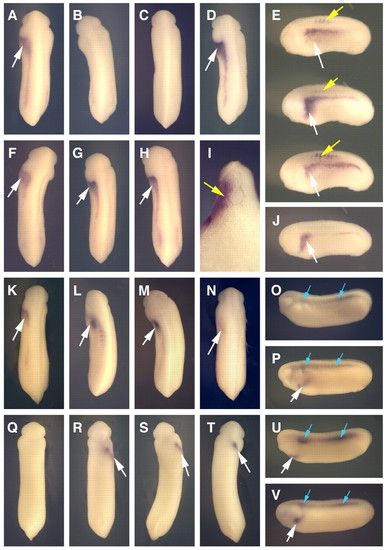
Left-side injection of XCR2 MO inhibits XNR1 and XATV expression in the lateral plate mesoderm (LPM). (A-N) In situ hybridization of XNR1. White arrows indicate the expression of XNR1 in the LPM. (A) Embryo injected with 10 ng of SC MO into the left side, showing normal XNR1 expression. (B) Injection of 10 ng of XCR2 MO into the left side caused no expression of XNR1 in the LPM. (C) Co-injection of 10 ng of XCR2 MO with 10 pg of pCS-EGFP plasmid into the left side caused no expression of XNR1 in the LPM. (D,E,I) Co-injection of 10 ng of XCR2 MO with 10 pg of pCS-XCR2 plasmid into the left side rescued the expression of XNR1 in the LPM and also caused ectopic XNR1 expression in the somite (yellow arrows). (I) Transverse section of the rescued embryo. Ectopic XNR1 expression in the somite was observed. (F,G) Right-side injection of 10 ng of SC MO (F) or XCR2 MO (G) did not affect XNR1 expression. (H,J) Uninjected control embryo. (K-N) Co-injection of 10 ng of XCR2 MO with 10 pg of XCR1 (K), XCR3S (L), XCR3L (M) or human CFC1 (N) plasmid in the left side rescued the expression of XNR1 in the LPM. (O-V) In situ hybridization of XATV in ventral view. Arrows indicate the expression of XATV in the left LPM (white) and the dorsal midline (blue). (O,Q) Embryo injected with 10 ng of XCR2 MO in the left side inhibited the expression of XATV in the left LPM, but not in the dorsal midline. (P,R) Embryo injected with 10 ng of XCR2 MO in the right side, showing normal XATV expression. (S,U) Co-injection of 10 ng of XCR2 MO with 10 pg of pCS-XCR2 plasmid in the left side rescued the expression of XATV in the left LPM. (T,V) Uninjected control embryo. |
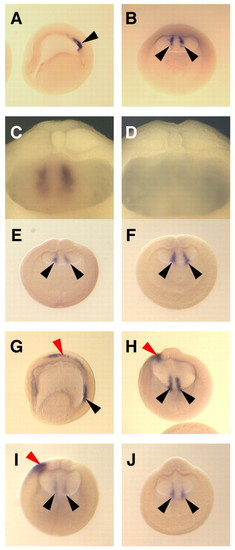
Bilateral expression of XNR1 is not affected by XCR2 MO injection. (A-C) Normal expression pattern of XNR1 in the posterior archenteron roof at stage 15 as determined by in situ hybridization using uninjected embryos. Asymmetric expression of XNR1 was not observed at stage 15. (C) Posterior archenteron roof of half-dissected embryo in side view. Two stripes of bilateral XNR1 expression were observed. (D) In situ hybridization with an XNR1 sense probe. No signal was observed in the archenteron roof. (E,F) Injection of 20 ng of SC MO (E) or of XCR2 MO (F) into the marginal region of both blastomeres at the two-cell stage. The bilateral expression of XNR1 is not affected at stage 15 in either condition. (G,H) Normal expression pattern of XNR1 at stage 20. The bilateral expression is maintained (black arrowheads) and asymmetric expression appears in the LPM (red arrowhead). (I) Injection of 20 ng of SC MO does not inhibit either bilateral or asymmetric expression of XNR1 at stage 20. (J) Injection of 20 ng of XCR2 MO inhibited the asymmetric expression of XNR1, but not bilateral expression at stage 20. (A,G) Lateral views. The anterior side is to the left. (B,E,F,H-J) Posterior views. The dorsal side is up. The embryo was cleared with benzyl benzoate/benzyl alcohol (A,B,E-J). Black arrowheads indicate the bilateral expression of XNR1; red arrowheads indicate the asymmetric expression of XNR1. |
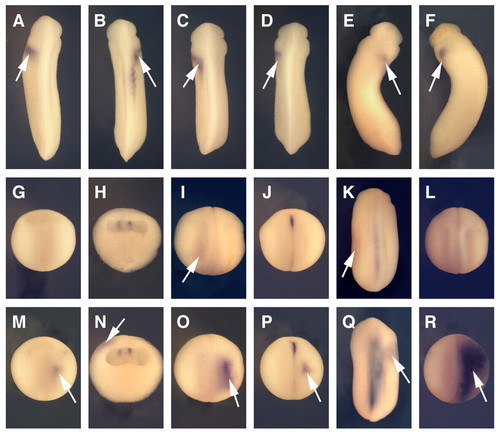
Right-side overexpression of XCR2 causes left-right inverted gene expression. (A-D,G-I,M-O) In situ hybridization of XNR1 in dorsal view (A-D,G,I,M,O), anterior side at top, and in side view of a half-dissected embryo (H,N). (E,F,J,K,P,Q) In situ hybridization of XATV in ventral view (E,F) and in dorsal view (J-K,P,Q). (L,R) In situ hybridization of XCR2 in dorsal view. (A,G-H) Embryo injected with 40 pg of pCS-EGFP plasmid in the right side. (B,M-R) Embryo injected with 40 pg of pCS-XCR2 into the right side. (A,E) Embryo showing normal expression of XNR1 (A) or XATV (E) in the left LPM (arrow) at stage 25/26. (B,F) Right-side XCR2 overexpression caused right-side expression of XNR1 (B) or XATV (F; arrow), and suppressed the left-side expression at stage 25/26. (C,D) Injection of 40 pg of pCS-XCR2 mEGF (C) or pCS-XCR2 mCFC (D) into the right side did not affect the expression pattern of XNR1 (arrow) at stage 25. (G-L) Embryos injected with pCS-EGFP plasmid in the right side. XNR1 expression was not detected in the LPM at stage 15 (G) and stage 16 (H), but was detectable at stage 20 (I) (arrow). XATV expression was not detected in the LPM at stage 17 (J), but was detectable at stage 23 (K; arrow). XCR2 was expressed broadly at stage 20 (L). (M-R) Embryo injected with pCS-XCR2 plasmid in the right side. XNR1 expression was ectopically expressed in the right LPM at stage 15 (M) and stage 16 (N), in addition to posterior bilateral expression. Strong XNR1 expression was detected on the right side (arrow), but not on the left side at stage 20 (O). Ectopic XATV expression (arrow) was detected in the right LPM at stage 17 (P). XATV expression was detected on the right side (arrow), but not on the left side at stage 23 (Q). Left-side expression of XCR2 was not affected, but very strong expression was detected on the right (injected) side at stage 20 (R). |