
- Title
-
Directional asymmetry of the zebrafish epithalamus guides dorsoventral innervation of the midbrain target
- Authors
- Gamse, J.T., Kuan, Y.S., Macurak, M., Brosamle, C., Thisse, B., Thisse, C., and Halpern, M.E.
- Source
- Full text @ Development
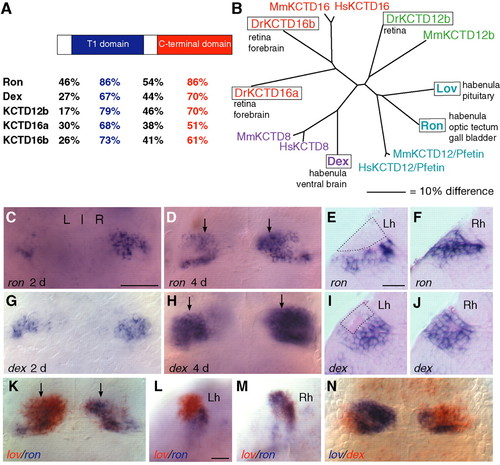
leftover (lov)-related genes are asymmetrically expressed in zebrafish diencephalon. (A) Five zebrafish proteins, Right on (Ron), Dexter (Dex), and Potassium channel tetramerization domain-containing proteins 12b (Kctd12b), 16a and 16b, are structurally similar to Lov (% amino acid identity indicated), contain an N-terminal T1 domain related to the tetramerization domain of the Shaker potassium channel (blue box) and a conserved C-terminal domain (red box) (see Gamse et al., 2003). (B) Zebrafish Lov-related family members (boxed) and homologous mammalian proteins fall into four major groups (designated by colors). The unrooted phylogenetic tree was calculated using the CLUSTAL_X algorithm (Thompson et al., 1997). Scale bar indicates a 10% difference in amino acid identity, measured along the shortest path between two proteins. Dr, Danio rerio; Mm, Mus musculus; Hs, Homo sapiens. (C,D,G,H) Asymmetric expression of (C) ron and (G) dex in habenular nuclei is detected at 2 days, and increases significantly by 4 days (D,H). Parasagittal sections through (E,I) left (Lh) and (F,J) right (Rh) habenulae reveal ron and dex transcripts throughout Rh, but confined to more ventral regions of Lh (dorsal regions outlined in E and I). (K-M) Double in situ hybridization shows lov and ron DV expression is largely non-overlapping in Lh (L) but coextensive in Rh (M). (N) dex habenular expression partially overlaps with lov, although most dex-expressing cells in Lh are more ventral than lov-expressing cells. C,D,G,H,K and N are dorsal views with anterior to the top; scale bar: 50 µm. Left (L) and right (R) sides of the brain and midline, indicated in C, apply to all dorsal views. Arrows in D,H and K indicate approximate position of sections shown in subsequent panels. E,F,I and J are parasagittal plastic sections (8-10 µm) with dorsal to the top and anterior to the left; scale bar: 20 µm. L and M are vibratome sections (100 µm) with dorsal to the top and anterior to left; scale bar: 30 µm. |
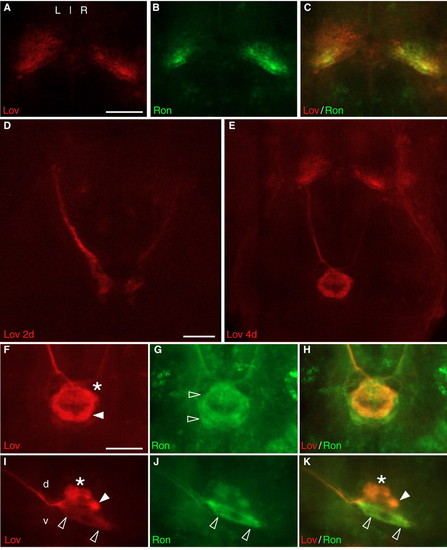
Asymmetric distribution of Lov and Ron in habenular neurons and their projections. (A-C) Immunofluorescent detection of (A) Lov and (B) Ron proteins and (C) colocalization in the habenular nuclei correlates well with the pattern of transcriptional domains (see Fig. 1). (D) Growth cones of Lov+ habenular efferents in FR reach the ventral midbrain by 2 days. (E) By 4 days, asymmetric Lov+ habenular projections traverse the target IPN. (F,I) Lov+ and (G,J) Ron+ axons project to different domains along dorsoventral axis of IPN. (I) Lov+ neurons terminate in anterior (asterisk) and posterior (closed arrowhead) regions of dorsal IPN and in ventral IPN (open arrowheads); (J) most Ron+ neurons project to ventral IPN. (Ron+ immunofluorescence at dorsal IPN was barely distinguishable from background levels, which were always higher than observed with the Lov antiserum.) All images are confocal Z-stacks from (A-H) the dorsal aspect, anterior to top, or (I-K) the lateral aspect, anterior to left. Scale bars: 30 µm (A-C,F-K); 50 µm (D,E). |
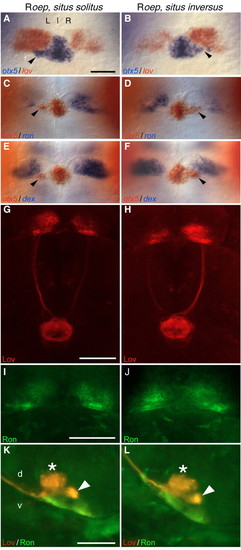
Lov and Ron distribution reflects directional asymmetry of habenulae. (A,C,E) Approximately 50% of Roep larvae show directional asymmetry of the epithalamus similar to WT (situs solitus), with a left-positioned parapineal, expanded lov (n=17/41) and reduced ron (n=13/24) and dex (n=10/25) expression in the left habenula. (B,D,F) Remaining Roep larvae show mirror image reversal (situs inversus) in parapineal position and habenular gene expression patterns. (A-F) Parapineal position (arrowhead) was confirmed by otx5 expression (Gamse et al., 2002). Dorsal views, anterior to top; scale bar: 50 µm. (G,H) Lov protein levels are higher in left habenula and FR of WT larvae (see Fig. 2) and half of Roep larvae (G; n=39/70). The other Roep larvae show a L-R reversal in Lov immunofluorescence (H; n=31/70). (I,J) Ron immunofluorescence is expanded in WT right habenula (see Fig. 2) and in half of Roep larvae (I; n=39/70). In L-R reversed Roep larvae, the Ron+ domain is expanded on the left (J; n=31/70). G-J are confocal Z-stacks from the dorsal aspect, anterior to top; scale bars: 40 µm. (K) In Roep larvae with a WT pattern of habenular asymmetry, Lov+ and Ron+ efferents project to dorsoventral and ventral IPN domains, respectively. (L) In L-R reversed larvae, projections along the DV axis of IPN are maintained, although Lov+ and Ron+ efferents emerge from the opposite side of the brain. (K,L) Confocal Z-stacks from the lateral aspect, anterior to left. Asterisk and arrowhead indicate anterior and posterior domains of dorsal IPN. Scale bar: 30 µm. EXPRESSION / LABELING:
|
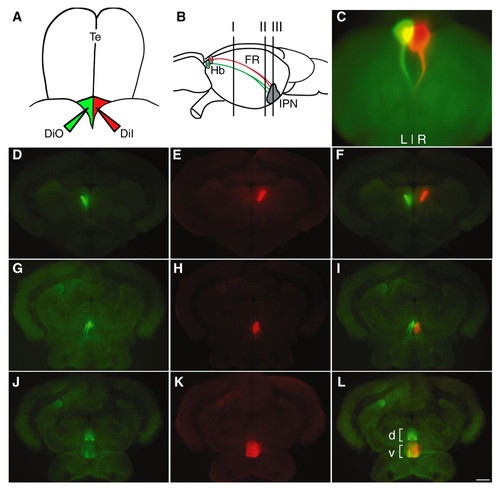
Selective labeling of L-R habenulae in adult zebrafish brain. (A) Schematic of adult zebrafish dorsal brain. The paired habenular nuclei lie at the dorsal surface of the diencephalon posterior to the telencephalon (Te) and anterior to the optic tectum. The habenular commissure was severed and DiI was injected into the right habenula (red) and DiO into the left habenula (green) (Aizawa et al., 2005). (B) Schematic of adult habenulointerpeduncular tract (sagittal view, anterior left) indicating approximate positions of transverse sections (150 µm) in D-L: I, D-F; II, G-I and III, J-L. (C) DiO- and (D-L) DiI-labeled left and right habenular projections along the fasciculus retroflexus to IPN viewed dorsally. Fluorescent images were captured using GFP3 (D,G,J) or rhodamine filter sets (E,H,K). (F,I,L) Digital overlay of DiO and DiI images. Dorsal (d) and ventral (v) regions of the target are indicated in L. Scale bar: 120 µm. |
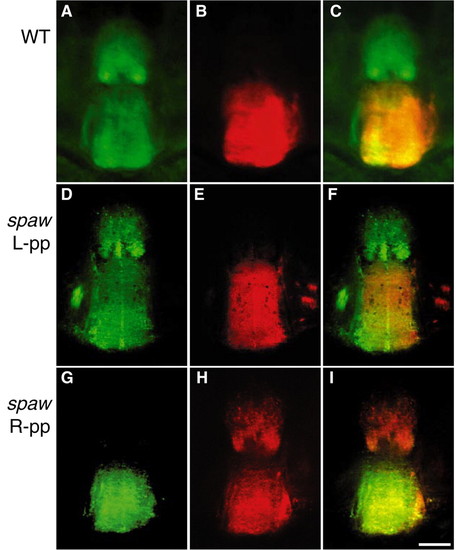
Directional asymmetry influences IPN projection pattern. Habenular projections onto the IPN in sections (150 µm) through adult midbrain of (A-C) WT and (D-I) spaw MO-injected fish, which as larvae had a left (D-F) or right (G-I) positioned parapineal. (A-F) Axons originating from left habenula innervate dorsal and ventral IPN domains, while those from the right habenula only project ventrally. (G-I) In fish with reversed epithalamic laterality, L-R origin of IPN projections is also reversed, such that axons from left habenula now innervate only the ventral IPN. A-C are higher magnification Leica MZFLIII images of the same brain as in Fig. 4. D,E and G,H were imaged using a Leica SP2 confocal microscope and merged to produce the composite images in F,I. Dorsal is at the top in all images. Scale bar: 60 µm. |
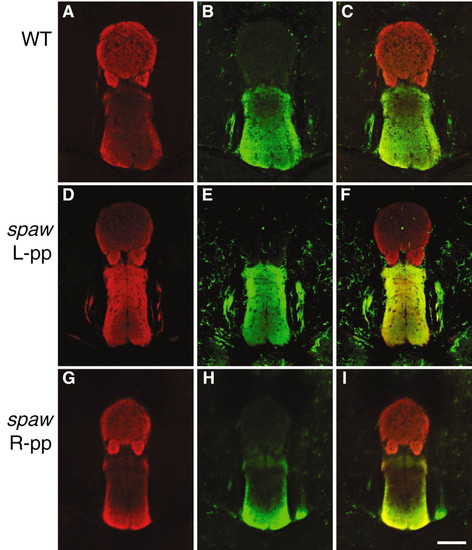
DV difference in Lov+ and Ron+ habenular projections onto the adult IPN. Confocal images of anti-Lov (red) and anti-Ron (green) double-labeled horizontal sections through adult midbrain of (A-C) WT or (D-F) left-positioned parapineal and (G-I) right-positioned parapineal fish selected from spaw MO-injected Tg(foxD3:GFP) embryos and reared separately. Vibratome sections (150 µm) vary slightly in their coordinates along anteroposterior axis of the brain, accounting for differences in immunofluorescent signals. Although intensity of labeling varies between given sections, DV regionalization of immunoreactive habenular axons at the IPN is highly stereotypic. Dorsal is at the top in all images. Scale bar: 60µm. |
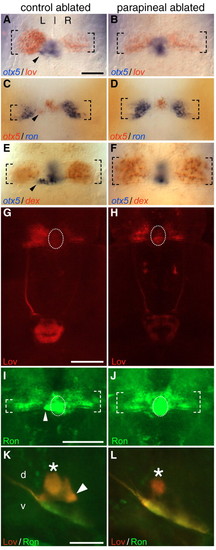
The parapineal mediates asymmetry of the habenulointerpeduncular system. (A,C,E) Control-ablated larvae (dashed brackets indicate anteroposterior extent of gene expression). otx5 expression confirmed parapineal position (arrowhead in A,C,E) and extent of ablation. (B,D,F) Parapineal ablation results in reduced lov (B; n=24), and expanded ron (D; n=58) and dex (F; n=16) expression in left habenula (4 days). A-F are dorsal views, anterior to top; scale bar: 50 µm. (G-J) Control-ablated Tg(foxd3:GFP) larvae (n=27) show WT pattern of Lov (G) and Ron (I) immunofluorescence. GFP is detected in the pineal (dotted oval) and parapineal (arrowhead) of transgenic larvae even after fixation and antibody labeling. Following parapineal ablation (n=42), Lov labeling (H) was reduced in the left habenula and axons in the left FR, while Ron immunofluorescence (J) expanded in the left habenula. G-J are confocal Z-stacks from the dorsal aspect, anterior to top; scale bars: 40 µm for G,H and I,J. (K) Control ablated larvae show the same IPN projection pattern as WT (see Fig. 2). (L) In parapineal ablated larvae, Lov+ projections to dorsal IPN are reduced and Ron+ axons increased ventrally. Asterisk and arrowhead in K indicate anterior and posterior domains of dorsal IPN. K,L are confocal Z-stacks from the lateral aspect anterior to the left; scale bar: 30 µm. |
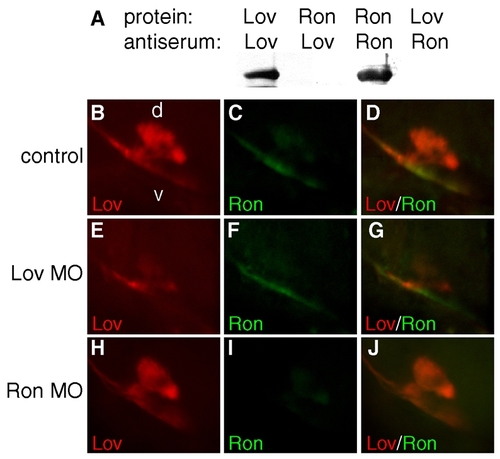
Specificity of Leftover and Right on antisera. (A) Western blot showing detection of bacterially expressed Lov or Ron protein (1 mg) by anti-Lov (lanes 1, 2) and anti-Ron (lanes 3, 4) rabbit polyclonal antiserum, and the lack of cross-reactivity. (B-J) Embryos injected with 3 ng of lov or ron morpholino (complementary to the 5¢ UTR proximal to the start ATG) were harvested at 3.5 days, at which time Lov and Ron proteins were detected by immunofluorescence of habenular projections to the interpeduncular nucleus. Upon injection of Lov MO, Lov (E) but not Ron immunofluorescence (F) was significantly reduced relative to uninjected control larvae (B,C). Conversely, ron MO injections resulted in reduced Ron immunofluorescence (I) at the IPN, but did not affect Lov labeling (J). All confocal images are lateral views of the dorsal (d) and ventral (v) IPN, as indicated in B. EXPRESSION / LABELING:
|
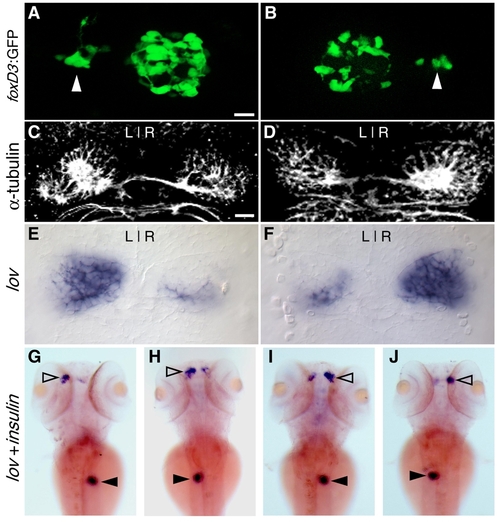
Southpaw (Spaw) regulates the direction of epithalamic asymmetry. Spaw MO-depleted larvae show either a WT (sinistral; A,C,E,G,H) or reversed (dextral; B,D,F,I,J) pattern of epithalamic laterality. (A,B) Dorsal view of fluorescently labeled pineal complex in foxD3:GFP transgenic larvae at 2 days. Position of the parapineal is indicated (white arrowhead). (C,D) Dense neuropil in the habenular nuclei is revealed by confocal imaging of anti-acetylated tubulin immunofluorescence in a 4-day larva. (E,F) Asymmetric expression pattern of the lov gene at 4 days. (G-J) Whole-mount in situ hybridization to detect lov habenular expression (open arrowhead) and insulin transcripts in the pancreas (black arrowhead) reveals the four major classes of larvae obtained following spaw MO injection. The direction of habenular asymmetry and L-R positioning of the pancreas are randomized, but in an independent manner. All images are dorsal views, anterior to the top. Scale bar: 8 mm (A,B); 20 mm (C,D). |