
- Title
-
beamter/deltaC and the role of Notch ligands in the zebrafish somite segmentation, hindbrain neurogenesis and hypochord differentiation
- Authors
- Julich, D., Hwee, Lim C., Round, J., Nicolaije, C., Schroeder, J., Davies, A., Geisler, R., Lewis, J., Jiang, Y.J., Holley, S.A., Tübingen 2000 Screen Consortium.
- Source
- Full text @ Dev. Biol.
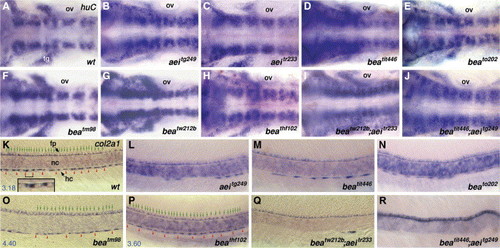
Molecular phenotypes of bea, aei single and bea/aei double mutants during neurogenesis and hypochord formation. In situ hybridization of huC at approximately 30 hpf (A–J). Embryos of wild-type (A), aeitg249 (B), aeitr233 (C), beatit446 (D), beato202 (E), beatm98 (F), beatw212b (G), beathf102 (H), beatw212b; aeitr233 (I) and beatit446; aeitg249 (J). Note that the hindbrain neurons are increased in bea and aei single mutants as well as in bea/aei double mutants. Otic vesicle (ov) is the landmark for rhombomere 5. Lateral views of embryos labeled for col2a1 RNA expression at approximately 30 hpf (K–R). In wild-type embryo (K, fp/hc = 3.04 ± 0.32, n = 6), col2a1 is expressed in floor-plate (fp) cells and hypochord (hc) cells, immediately dorsal to and ventral to notochord (nc), respectively. Bracket denotes one hypochord cell, whose enlargement is shown in the insert. Each green arrow indicates a floor-plate cell; each red arrowhead indicates the boundary between two hypochord cells. The blue number at the bottom left corner is the number ratio of floor-plate cells to hypochord cells (fp/hc). Obvious gaps in hypochord can be seen in aeitg249 (L), beatit446 (M), beato202 (N) and beatw212b; aeitr233 (Q) mutants, indicating a reduction in the numbers of differentiated hypochord cells while putative double null beatit446; aeitg249 (R, n = 5) have no hypochord cells. Though there is no obvious gap, hypochord cells in beatm98 (O, fp/hc = 4.56 ± 0.47, n = 6) and beathf102 (P, fp/hc = 3.36 ± 0.17, n = 3) mutants are elongated and, therefore, reduced in number and increased in fp/hc ratio (compare the fp/hc ratio and/or the length of hypochord cell to that of wild-type embryos). All floor plate cells look normal. Anterior is to the left (A–R) and dorsal to the top (K–R). Abbreviation: fp, floor plate; hc, hypochord; nc, notochord; ov, otic vesicle; tg, trigeminal ganglion neurons. fp/hc ratio is expressed in average ± standard deviation format; n: numbers of examined embryos. EXPRESSION / LABELING:
|
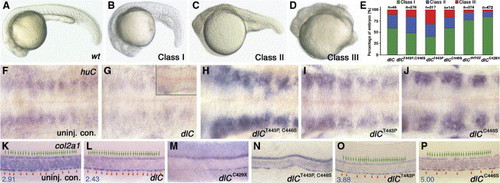
Morphology and molecular characterization of embryos injected with different constructs of deltaC mRNA. (B–D) Injected embryos display a range of phenotypes that can be grouped into three distinct classes showing various degrees of retarded growth and axial defects. Wild-type (A, wt) at approximately at 22 hfp, Class I (B) embryo with delayed growth, Class II (C) embryo with retarded growth, malformed tail and short body axis and Class III (D) embryo with severe retarded growth, short body axis without notochord and somites (with defects mainly attributed to injection artifacts). (E) Bar graph displays the relative proportions of each morphological class in response to the different constructs of deltaC mRNA injected, n: numbers of examined embryos. huC staining of uninjected control (F), class I dlC-injected (G, class II in the insert), class I dlCT443P, C446S-injected (H), class I dlCT443P-injected (I) and class I dlCC446S-injected (J) embryos at approximately 30 hpf. Note that while neurons are increased in dlCT443P, C446S-, dlCT443P- and dlCC446S-injected embryos, huC-positive neurons are decreased in dlC-injected embryos. Lateral view of ∼30 hpf embryos labeled for col2a1 RNA expression in uninjected control (K, fp/hc = 3.04 ± 0.32, n = 6), class I dlC-injection (L, fp/hc = 2.32 ± 0.10, n = 5), class I dlCC429X-injection (M): 30.4% (52/171) embryos have more severe anterior hypochord phenotype than uninjected beatit446 mutants; 75% (42/56) class II dlCC429X-injected embryos have more severe anterior hypochord phenotype, class I dlCT443P, C446S-injection (N): 11.5% (7/61) embryos have gaps in between hypochord cells while 88.5% embryos (54/61) have small and localized gaps (not shown), class I dlCT443P-injection (O): most of the embryos were found to have floor-plate and hypochord cells morphologically similar to those of beatm98 mutant, while 6.9% (3/43) of the embryos have gaps in hypochord (not shown) and class I dlCC446S-injection (P): 57.1% (12/21) embryos have elongated hypochord cells. Each green arrow indicates a floor-plate cell; each red arrowhead indicates the boundary between two hypochord cells. The blue number at the bottom left corner is the ratio of number of floor-plate cells to number of hypochord cells (fp/hc). All floor cells plate look normal. Anterior is to the left (F–O) and dorsal to the top (K–O). fp/hc ratio is expressed in average ± standard deviation format; n: numbers of examined embryos. EXPRESSION / LABELING:
|
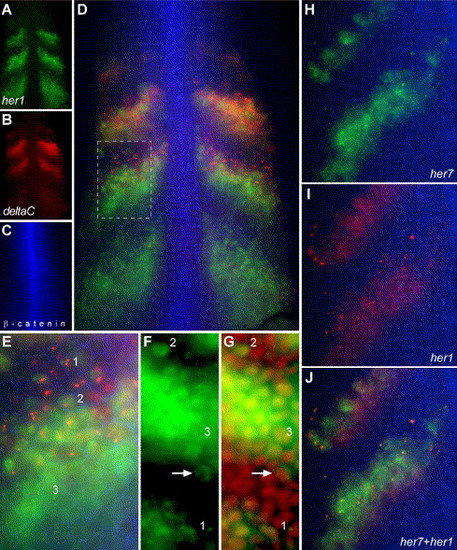
Single-cell resolution of distinct phases of oscillations in transcription within the PSM. (A–E) A wild-type embryo stained for her1 mRNA (A), deltaC mRNA (B) and β-catenin protein (C). β-catenin protein in the cell cortex outlines each cell, allowing the examination of cell morphology and gene expression in the same cells. (D) Overlay of A, B and C. (E) Higher magnification view of the boxed region in D. In D, one can see that her1 and deltaC are differently regulated and that generally deltaC expression precedes (is shifted anteriorly relative to) her1 expression in the middle stripe, but not the other two stripes. However, in E, cells within the anterior of the middle stripe that express her1 but not yet deltaC can be seen. Note that her1 expression is more intense than deltaC expression in the posterior stripe and less intense than deltaC expression in the most anterior stripe, so that the “center of gravity” of the her1 distribution as a whole is posterior to that of the deltaC distribution. Also in E, three general patterns of mRNA localization can be seen. Pattern 1 appears as one or two intense spots while pattern 2 is broader but still restricted. In pattern 3, the mRNA is localized throughout the cell. Note that the intense spots of her1 and deltaC do not co-localize. (F, G) Patterns 1 and 2 are restricted to the nuclei. her1 mRNA localization (F) is compared to nuclei (red, propidium idodide staining) (G). The intense spots of pattern 1 co-localize to the nucleus suggesting that they may represent nascent transcripts at the her1 genomic loci. Pattern 2 co-localizes with the nucleus. The arrow shows a cell within the posterior of a stripe no longer is transcribing her1 and has exported most of the her1 mRNA into the cytoplasm. (H–J) Show the co-localization of the intense, subnuclear spots of her7 expression (H, green) and her1 expression (I, red). β-catenin localization is in blue in all panels. (J) Overlay of H and I. Since her1 and her7 are on the same chromosome, separated by only 12 kb, one would expect the intense, nuclear spots to co-localize if those spots represent nascent transcripts at the chromosomal loci. Likewise, the pattern 1 spots of deltaC and her1 would not be expected to co-localize since the two genes are on different chromosomes. (A–E, H–J) are wide-field images. (F, G) are confocal images. All panels are dorsal views of dissected tailbuds with anterior up. EXPRESSION / LABELING:
|
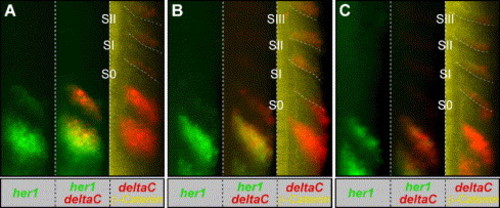
Analysis of her1 and deltaC expression in staged embryos reveals deltaC expression in transition from anterior half-somite to posterior half-somite. (A–C) shows the right half of the trunk of three progressively older embryos. These embryos were fixed at the 10 somite stage, processed to visualize her1 mRNA (green), deltaC mRNA (red) and β-catenin protein (yellow). The embryos were more precisely staged by measuring the distances between the expression domains and the morphological somite borders. Embryos with decreasing distances between the expression domains and borders are considered progressively older (Holley et al., 2000). For each embryo, her1 expression is shown alone (left) or overlain with deltaC expression (middle). deltaC expression is also overlain with β-catenin localization (right). Note that since the somitic expression of deltaC is weak relative to the PSM expression, in the deltaC/β-catenin overlay, we have altered the levels of the only somitic expression in order to visualize this expression without saturating the PSM expression. The somite borders are highlighted (dashed lines). EXPRESSION / LABELING:
|
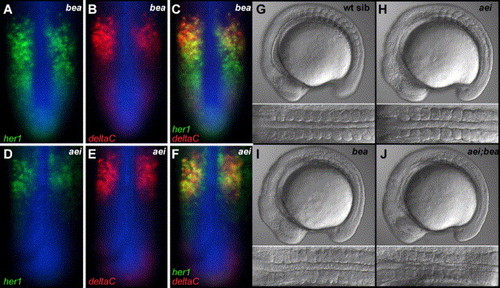
The oscillating expression patterns of her1 and deltaC are differentially affected in bea/deltaC and aei/deltaD mutants. (A–C) Show a bea/deltaCtit446 embryo stained for her1 mRNA (A, green), deltaC mRNA (B, red) and β-catenin protein (blue). (C) Overlay of A and B. The “salt and pepper” pattern of her1 extends more posteriorly than that of deltaC. (D–F) Show an aei/deltaDtg249 embryo stained for her1 mRNA (D, green), deltaC mRNA (E, red) and β-catenin protein (blue). (F) Overlay of D and E. The “salt and pepper” patterns of her1 and deltaC are both restricted to the anterior PSM. (G–J) Lateral and dorsal views of wild-type (G), aei/deltaDtg249 homozygotes (H), bea/deltaCtit446 homozygotes (I) and aei/deltaDtg249; bea/deltaCtit446 double homozygotes (J). At the 11 somite stage, there is no clear difference in the somite phenotype when comparing the bea/deltaC homozygotes to aei/deltaD; bea/deltaC double homozygotes. EXPRESSION / LABELING:
|
Reprinted from Developmental Biology, 286(2), Julich, D., Hwee, Lim C., Round, J., Nicolaije, C., Schroeder, J., Davies, A., Geisler, R., Lewis, J., Jiang, Y.J., Holley, S.A., Tübingen 2000 Screen Consortium., beamter/deltaC and the role of Notch ligands in the zebrafish somite segmentation, hindbrain neurogenesis and hypochord differentiation, 391-404, Copyright (2005) with permission from Elsevier. Full text @ Dev. Biol.