
- Title
-
Hepatic and extrahepatic expression of vitellogenin genes in the zebrafish, Danio rerio
- Authors
- Wang, H., Tan, J.T., Emelyanov, A., Korzh, V., and Gong, Z.
- Source
- Full text @ Gene
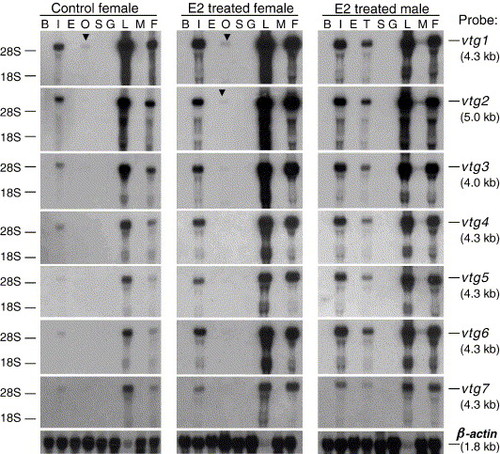
Northern blot analysis of tissue distribution of vtg mRNAs in both female and male zebrafish with or without E2 treatment. Total RNAs were prepared from selected tissues as indicated at the top of each lane: B, brain; I, intestine; E, eye; O, ovary; T, testis; S, skin; G, gill; L, liver; M, muscle; F, whole fish. 10 μg of total RNA was loaded each lane. Blots were first hybridized with 32P-labeled vtg probes and stripped and reprobed with a β-actin cDNA probe to ensure even loading and integrity of RNAs. Representative blots with the β-actin probe are shown at the bottom and consistently the level of β-actin mRNA is lower in the liver than in other tissues (Wang et al., 2000 and Mudumana et al., 2004). No vtg hybridization signal was detected in any tissue in control male zebrafish (not shown). The positions of 28S and 18S ribosomal RNAs are marked on the left and names of vtg transcripts with estimated molecular weights on the right. Weak signals in ovary total RNA are marked by arrowheads. EXPRESSION / LABELING:
|
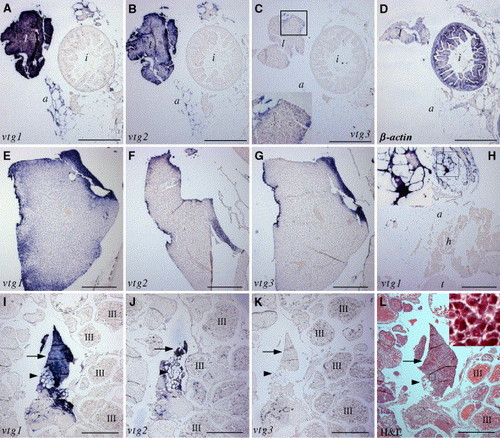
Expression of vtg mRNAs in hepatocytes and extrahepatic tissues. Section in situ hybridization was carried out as described in Materials and methods and the hybridization probes used are indicated in each panel. (A–D) Sections of internal organs including the liver and intestine from control female fish, showing the expression of vtg1–2 mRNAs as purple stains in the liver and adipocytes (A and B), weak expression of vtg3 mRNA in liver (C and inset), and ubiquitous expression of β-actin mRNA (D). (E–G) Sections of liver of E2-treated male fish, showing the expression of vtg1–3 mRNAs in the surface area of liver. (H) Section of testis and surrounding tissues from E2-treated male fish, showing the expression of vtg1 mRNA in adipocyte-like cells. (I–K) Ovary sections of control female fish, showing the expression of vtg1–2 mRNAs in fully developed adipose tissue (arrowheads) and underdeveloped adipose tissue (arrows). (L) Hematoxylin and eosin staining of an adjacent section of (I–K). Some stage III oocytes are labeled with “III” in (I)–(L). Insets in (C), (H), and (L) are enlargements of boxed regions, respectively. a, adipose tissue; h, hemocytes; i, intestine, l, liver, t, testis. Scale bars = 500 μm. |
Reprinted from Gene, 356, Wang, H., Tan, J.T., Emelyanov, A., Korzh, V., and Gong, Z., Hepatic and extrahepatic expression of vitellogenin genes in the zebrafish, Danio rerio, 91-100, Copyright (2005) with permission from Elsevier. Full text @ Gene