
- Title
-
bloodthirsty, an RBCC/TRIM gene required for erythropoiesis in zebrafish
- Authors
- Yergeau, D.A., Cornell, C.N., Parker, S.K., Zhou, Y., and Detrich, H.W. 3rd.
- Source
- Full text @ Dev. Biol.
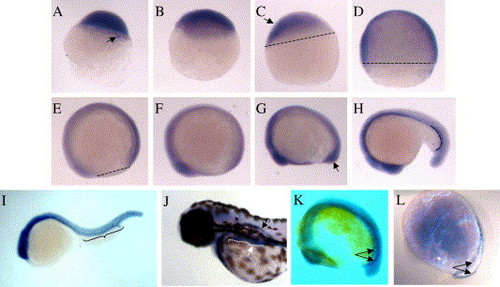
Whole-mount in situ hybridization of zebrafish embryos using antisense bty transcripts. Wild-type zebrafish embryos were collected at intervals and stained for bty expression as described in Materials and methods. (A) 256 cell, [2.5 h post fertilization (hpf)], arrow indicates staining in the yolk syncitial layer; (B) sphere (4 hpf); (C) 30% epiboly (4.7 hpf), arrow shows prominent bty staining along the animal pole to ventral axis; (D) 75% epiboly (8 hpf); (E) 90% epiboly (9 hpf); (F) 3-somite (11 hpf); (G) 6-somite (12 hpf), arrow denotes staining in the tail bud; (H) 20 somite (18.5 hpf); (I) 30-somite (24 hpf); (J) long pec (48 hpf), the white arrow points to the pronephric tubule (traced by the dotted line) in the foreground and the black arrow points to the second, bilaterally symmetric tubule on the opposite side of the embryo; (K) 16-somite (17 hpf), the paired arrows indicate the bilateral stripes of the ICM; and (L) 16-somite (17 h) embryo stained for gata1 expression, arrows as in panel (K). Embryos in panels (A–E) are oriented with their animal poles at the top. Somite- and long pec-stage embryos (F–J) are oriented with their anterior structures to the left. The short dashed lines in panels (C–E) indicate the position of the blastoderm edge as it migrates over the yolk cell during epiboly. The long-dashed line in panel (H) and the bracket in (I) show the approximate boundaries of the hematopoietic intermediate cell mass (ICM). Embryos in panels (A–J) were micrographed in 70% glycerol/PBS using a Nikon dissecting microscope. Embryos in panels (K) and (L) were micrographed in 2:1 benzylbenzoate:benzyl alcohol using a Nikon Eclipse 800 and DIC optics. |
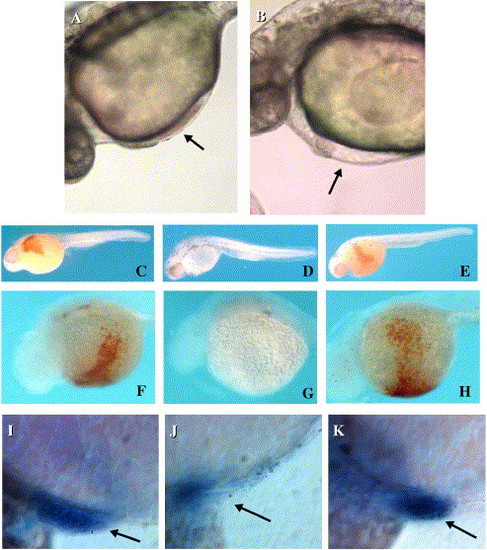
Suppression of red blood cell formation in zebrafish embryos by antisense MOs targeted to the bty mRNA. (A–B) DIC microscopy of zebrafish embryos in vivo 28 hpf (Nikon Eclipse 800). (A) Non-injected, wild-type embryo. The arrow shows circulating erythrocytes in the heart. (B) Wild-type embryo injected at the two cell stage with 10 ng of Zebb302 antisense MO targeted to the bty start codon and 21 residues downstream. Although the heart beat normally, circulating blood cells were absent (arrow). (C–E) Hemoglobin detection by o-dianisidine, whole embryo lateral view (32 hpf). Fixed and stained embryos were micrographed in 70% glycerol/PBS using the Nikon dissecting microscope. (C) Danieau′s injected wild-type embryo. The circulation stained reddish brown when reacted with o-dianisidine, indicating the presence of hemoglobin-expressing red cells. (D) Antisense MO Zebb 302a, 5 ng. Note the nearly complete absence of red blood cells. (E) Control 5-bp mismatch MO Zebb302e, 5 ng. Red blood cells were present at wild-type levels. (F–H) Hemoglobin detection by o-dianisidine, view of venous circulation over yolk to heart. Embryos were micrographed as in panels (C–E). (F) Uninjected wild-type embryo. (G) Antisense MO Zebb302a, 10 ng. (H) Control 4-bp mismatch MO Zebb302c, 10 ng. (I–K) Whole-mount in situ hybridization of MO-treated zebrafish to α-globin antisense RNA (32 hpf). Micrographs were recorded using a Nikon Eclipse 800 in DIC mode. (I) Uninjected embryo. (J) Embryo injected with 10 ng of Zebb302 antisense MO. (K) Embryo injected with 15 ng of control 4-bp mismatch MO Zebb302b. The arrows indicate the position of the heart. Globin-positive red cells were greatly reduced in the experimental MO-injected embryo. EXPRESSION / LABELING:
|
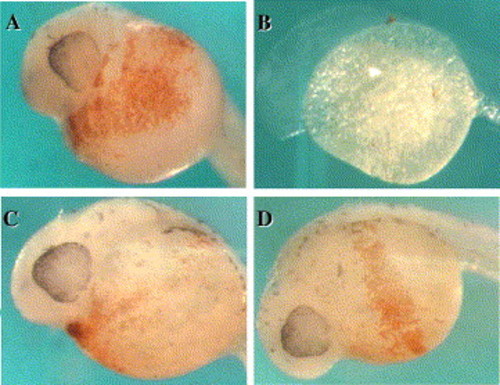
Rescue of the bty phenotype by co-injection of an antisense MO and a synthetic bty mRNA with an artificial 5′-UTR. Embryos were stained with o-dianisidine at 32 hpf to detect the hemoglobin-expressing red blood cells. (A) Wild-type embryo, uninjected. (B) Embryo injected with Zebb302a antisense MO, 5 ng. (C) Embryo co-injected with Zebb302a MO (5 ng) and synthetic bty mRNA (10 pg). (D) Embryo co-injected with Zebb302a MO (5 ng) and synthetic bty mRNA (100 pg). |
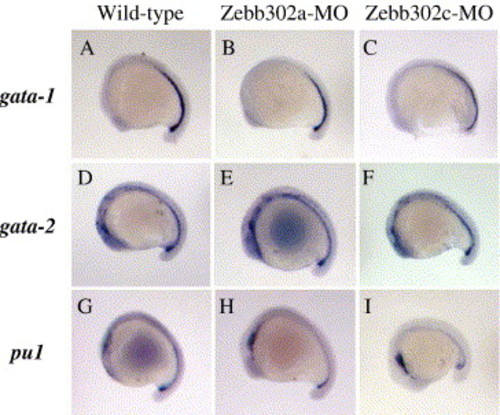
Whole-mount in situ hybridization of blood markers to MO-injected embryos at 18 hpf. Wild-type (no injection), Zebb302a, and Zebb302c injected fish were collected at 18 hpf. Fish were treated with antisense cRNA probes for gata-1 (erythroid development, A–C), gata-2 (early hematopoietic stem cell, D–F), and the myeloid marker pu1 (G–I). All embryos were photographed in 70% glycerol/PBS using a Nikon dissecting microscope. EXPRESSION / LABELING:
|
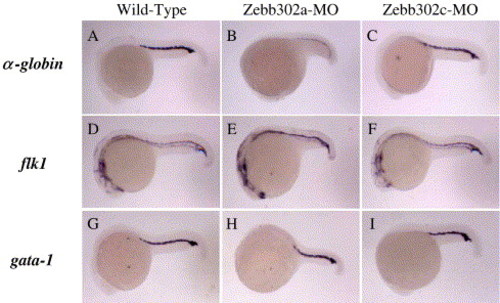
Whole-mount in situ hybridization of MO-injected embryos at 23 hpf using blood and vascular markers. Wild-type (no injection), Zebb302a, and Zebb302c injected fish were collected at 23 hpf, at which time each had developed 28 somites. Fish were treated with antisense cRNA probes for α-globin (A–C), flk1 (D–F), and gata-1 (G–I). Embryos were photographed in 70% glycerol/PBS using a Nikon dissecting microscope. EXPRESSION / LABELING:
|
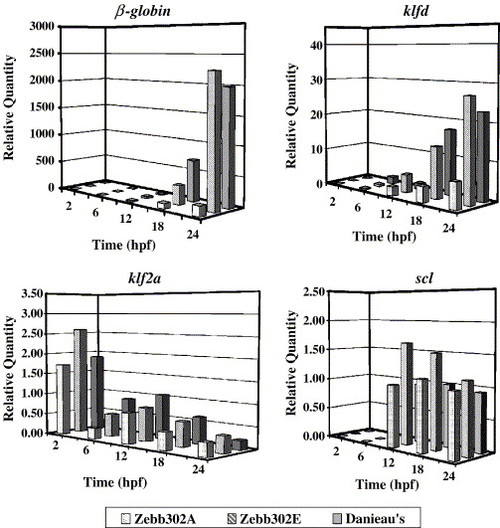
Measurement of erythropoietic and vasculogenic gene transcript levels after MO injection by real-time RT-PCR. Wild-type embryos were injected with antisense MO (Zebb302), a 5-bp mismatch MO (Zebb302e), or Danieau′s solution as described under Materials and methods. Total RNA was collected from pooled embryos (7 per treatment) at each time point, and transcript levels for β-globin, klfd, klf2a, and scl were determined by the comparative threshold cycle method. For β-globin, the mRNA level for antisense-MO-treated embryos was suppressed significantly at 18 h with respect to the Danieau′s treatment (P = 0.002) but not with respect to the 5-bp mismatch MO. At 24 h, β-globin mRNA levels observed for the antisense MO were significantly different from those observed for the 5-bp mismatch MO and Danieau′s solution controls [P = 0.0016 and 0.00011, standard error of the difference (SED)], whereas the levels for the two controls were not significantly different. klfd expression was reduced significantly at 18 h (P = 0.020 and 0.0042, respectively, SED) and at 24 h (P = 0.011 and 0.019, respectively, SED) with respect to the two controls. By contrast, there were no significant differences among the three treatment conditions for klf2a and scl mRNA levels (range of P values for all time points = 0.09–0.86, ANOVA). EXPRESSION / LABELING:
|
Reprinted from Developmental Biology, 283(1), Yergeau, D.A., Cornell, C.N., Parker, S.K., Zhou, Y., and Detrich, H.W. 3rd., bloodthirsty, an RBCC/TRIM gene required for erythropoiesis in zebrafish, 97-112, Copyright (2005) with permission from Elsevier. Full text @ Dev. Biol.