
- Title
-
Staggered cell-intrinsic timing of ath5 expression underlies the wave of ganglion cell neurogenesis in the zebrafish retina
- Authors
- Kay, J.N., Link, B.A., and Baier, H.
- Source
- Full text @ Development
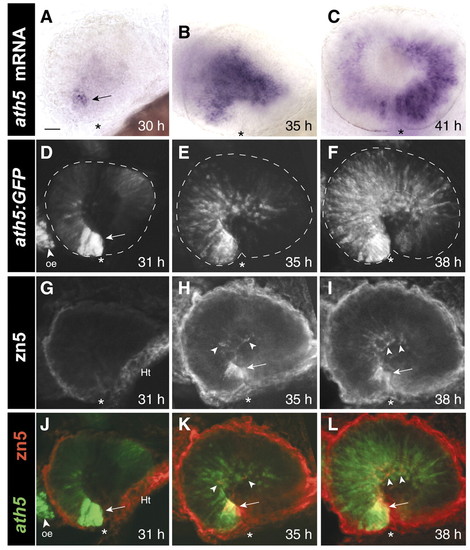
The spatiotemporal pattern of RGC neurogenesis in zebrafish. Spread of ath5 mRNA (A-C), ath5:GFP (D-F) and RGC differentiation (G-I) across the retina. (A-C) Whole-mount embryos stained with an antisense ath5 riboprobe. (D-I) Whole-mount embryos double-stained with anti-GFP (D-F) and zn5 (G-I) antibodies. (J-L) Merge of D-F (ath5:GFP, green) with G-I (zn5, red), showing that the ath5 wave leads the RGC differentiation wave by several hours. D-L are z-projections of stacks of confocal images. Arrows in A,D and H-L indicate the ventronasal patch. No RGCs are present at 31 h (G), although zn5-immunoreactive tissue is seen in the heart (Ht). Arrowheads in H-I and K-L indicate zn5+ RGCs. Note that ath5 RNA expression is transient, becoming downregulated behind the wave (C), whereas GFP expression (F) persists longer and thus acts as an indelible marker of all cells that have expressed ath5. Asterisks mark the location of choroid fissure, which delineates the boundary between nasal and temporal retina. Anterior (nasal) is left and dorsal up in all figures. Scale bar: 25 µm. oe, olfactory epithelium; Ht, heart. |
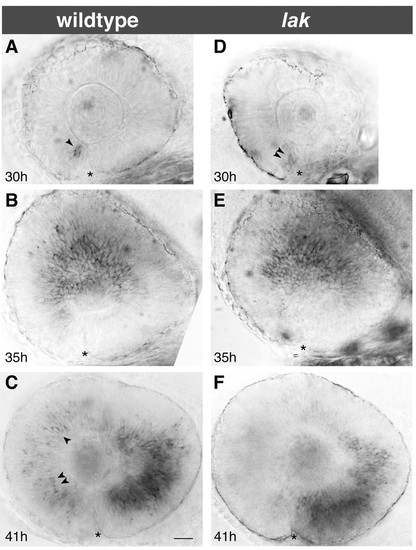
RGCs are not required for spread of ath5 expression. (A-C) Expression of ath5 mRNA at 30 hpf (A), 35 hpf (B) and 41 hpf (C) in wild-type fish from a lak/+ incross. At 41 hpf (C), the ath5 wave has progressed into the ventrotemporal retina and has cleared out of the anterior and central regions, but occasionally cells behind the wave front still express ath5 (arrowheads). (D-F) Progression of ath5 wave in lak mutants is indistinguishable from wild-type. Expression of ath5 behind the wave front is reduced in lak mutants, perhaps due to autoregulation of ath5 expression (F; compare with C). Anterior (nasal) is left and dorsal up in all images. Asterisks indicate choroid fissure. Scale bar: 25 µm. |
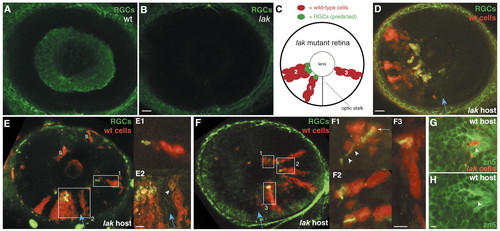
RGC neurogenesis in the absence of RGC-derived signals. (A,B) Zn5 staining of wild-type (A) and lak mutants (B) at 55 hpf. Mutant retina is devoid of RGCs. (C) Schematic showing predicted results of transplant experiments, based on the sequential-induction model. Red cells represent wild-type clones in a lak mutant retina. The clone marked 1 is predicted to give rise to RGCs (green) because it is near the optic stalk (dashed circle). Clone 2 is predicted to give rise to RGCs because it is near clone 1, which contains earlier-born RGCs. Clone 3 is located far from the optic stalk and from RGCs; the model predicts it should fail to give rise to RGCs. (D-F) Wild-type-into-lak chimeras. (D) Only wild-type cells (red) give rise to zn5+ RGCs (green). (E) A wild-type-into-lak chimera that challenges the sequential-induction model. One clone (E1) is completely surrounded by mutant tissue and yet still forms RGCs (green). (E1, E2) High-magnification views of indicated boxed areas, showing expression of RGC markers (green) by wild-type cells (arrowhead). Both are at the same scale. (F) A wild-type-into-lak chimera in which donor cells are present only in temporal retina. These clones give rise to zn5+ RGCs. (F1-F3) High-magnification views of boxed areas (all are at the same scale). In F1, an axon (arrowheads) extends from the double-labeled RGC cell body (arrow). (G,H) A lak-into-wild-type chimera, showing that ath5 is cell-autonomously required for RGC formation. Mutant donor cells (red; arrowhead) are the only cells in the GCL not labeled with zn5 (green). (H) The same field of view, showing zn5 alone to illustrate the gap in zn5 expression where the lak cells are (arrowhead). Anterior/nasal is left and dorsal up in all images. The blue arrow indicates the choroid fissure. S, donor-derived skin cells, not in neural retina; wt, wild type. Scale bars: in B,D, 20 µm for A,B,D,E,F; 5 µm for E2,F3,H. EXPRESSION / LABELING:
|
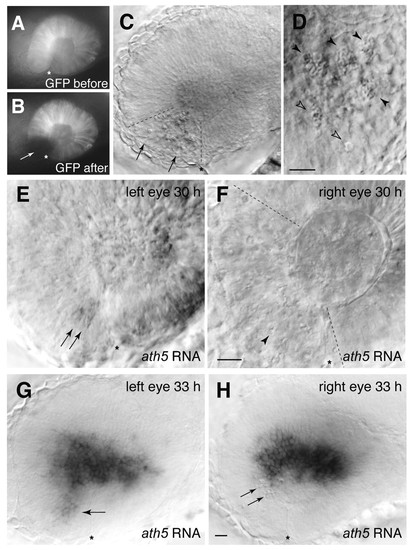
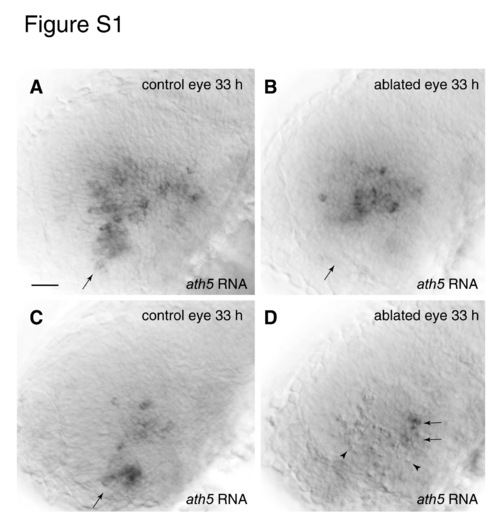
Laser ablation of the ventronasal retina does not block the spread of ath5 into the central retina. (A,B) Targeting of ventronasal retina for laser ablation. A single larva homozygous for the Pax6DF4:mGFPs220 transgene was photographed before (A) and immediately after (B) the ablation procedure. The laser-targeted region is no longer fluorescent (arrow). (C-F) Laser-targeting of ventronasal retina at 24 hpf efficiently kills cells and prevents ath5 expression. (C) Pyknotic nuclei (arrows) were visible using DIC illumination and were found specifically within the laser-targeted region (delineated with dashed lines in C,F). Higher magnification (D) shows the characteristic pyknotic morphology of the dying cells (closed arrowheads indicate clusters of pyknotic cells; open arrowheads indicate single pyknotic cells). (E-F) Untreated (E) and treated (F) eyes of the same larva sacrificed at 30 hpf and stained for ath5 RNA expression. The initial patch of 2-3 ath5+ cells is present in the control eye (E, arrows) but absent in the treated eye (F). The arrowhead in F indicates one example of a pyknotic cell in the laser-targeted region. (G,H) Preventing ventronasal ath5 expression has no effect on subsequent ath5 expression. Untreated (G) and treated (H) eyes of a single larva ablated at 24 hpf and stained for ath5 expression at 33 hpf. In the intact eye (G), ath5+ cells are seen in ventronasal retina (arrow), as well as nasal and central regions. In the treated eye, ventronasal ath5 expression is abolished and pyknotic nuclei are evident (arrows). Nevertheless, nasal and central retinal ath5 expression is normal. Nasal/anterior is to the left, dorsal is up, and an asterisk marks the location of choroid fissure in all panels. See Fig. S1 in the supplementary material for more examples. Scale bars: in D, 10 µm; in F, 25 µm for E,F; in H, 25 µm for C,G,H. EXPRESSION / LABELING:
|
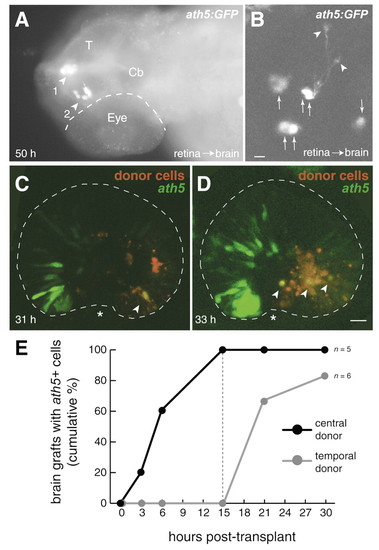
Retinal position cell-autonomously specifies timing of ath5 expression. (A,B) Retinal cells can express ath5 and form neurons in the absence of retinal signals. (A) Cells removed from the retina (before ath5 expression) and heterotopically transplanted into the head express ath5:GFP at 50 hpf. Dorsal view of fixed embryo immunostained for GFP. One cluster of GFP cells is at the dorsal midline, sitting between the epidermis and the tectum (arrowhead 1). The other GFP+ cluster is in the diencephalic ventricle (arrowhead 2). (B) Higher-magnification view of a different heterotopic retinoblast graft, located in the telencephalic ventricle. Single confocal scan taken from live fish at 50 hpf. Several cells express ath5:GFP (arrows). Some assume a morphology typical of RGCs, with growing axons tipped by growth cones (arrowheads). Anterior is left in both panels. Ventral is down in B. (C,D) Retinal signals cannot re-specify the timing of ath5 expression. Nasal donor retinoblasts (red) were grafted into temporal retina of an ath5:GFP transgenic host before onset of ath5 expression. Subsequently, when ath5 expression (green) had begun in host nasal retina, live hosts were imaged on a confocal microscope. Donor cells located ahead of the host′s ath5:GFP wave front expressed GFP (yellow cells; marked with arrowheads). Each image is a z-projection of a stack of confocal images. Asterisks mark choroid fissure. Nasal/anterior is left and dorsal up in both panels. (E) The relative timing of ath5 expression is maintained in the absence of retinal signals. Host embryos carrying either central or temporal retinal grafts in the brain ventricles were screened for ath5:GFP expression at various times post-transplant. The cumulative percentage of grafts expressing GFP was plotted for each time point. The central grafts (black line) expressed ath5:GFP before the temporal grafts (gray line). The dashed line indicates the time when all central grafts, but none of the temporal grafts, were GFP+. n=11 hosts (six temporal grafts and five central grafts). Scale bars: 5 µm in B; 25 µm in C,D. Cb, cerebellum; T, tectum. |
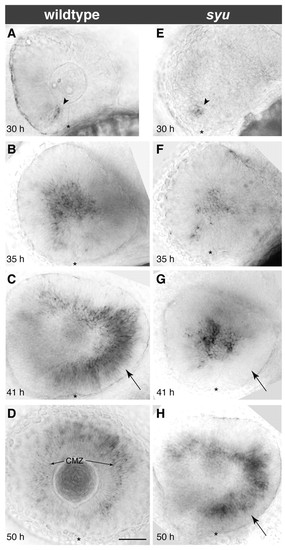
Delay of the ath5 wave caused by loss of shh signaling. Timecourse of ath5 expression in wild-type or mutant embryos derived from a syu t4/+ intercross. (A-D) In wild type, the wave front is: in the ventronasal retina at 30 hpf (A); in the central retina at 35 hpf (B); and in the temporal retina at 41 hpf (C). At 50 hpf (D), the wave is over and ath5 expression is seen only in the secondary retinal growth zone, the ciliary marginal zone (arrows in D). (E-H) In syu mutants, wave initiation is normal (E) but subsequently becomes delayed. About half of mutants show normal spread of ath5 wave to central retina by 35 hpf (F); the other half fail to show expression in central retina by 35 hpf (not pictured; see Fig. 7B). By 41 hpf (G) the delay phenotype is fully penetrant – note absence of ath5 expression in temporal retina at 41 hpf (arrow in G). By 50 hpf (H), ath5 expression reaches the temporal retina and has cleared from the central retina, much like in wild type at 41 hpf (arrows in H,C). Nasal/anterior is left and dorsal is up in all panels. Asterisks mark the choroid fissure. Scale bar: 50 µm. CMZ, ciliary marginal zone. |
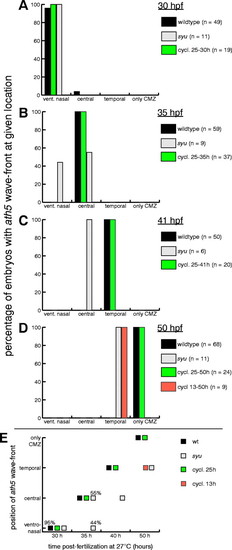
Correct timing of the ath5 wave requires Sonic hedgehog signaling before, but not during, retinal neurogenesis. (A-D) The position of the ath5 wave front was quantified in all embryos from the syu and cyclopamine experiments. Each embryo was scored for the quadrant of the retina in which the wave front was located: either ventronasal, central or temporal. If the wave was over, and ath5 expression was confined to the ciliary marginal zone the embryo was scored as `only CMZ′. The fraction of embryos at a given age falling into each of these four categories was plotted. Because we took care to ensure developmental synchrony, in most cases, the fraction was 100%. Examples of how the ath5 expression domain looked for each category are shown in Fig. 6A-D. (E) Summary of the results of syu and cyclopamine experiments. The retinal position of the ath5 wave front as calculated in A-D was plotted for groups of wild-type, syu mutant and cyclopamine-treated embryos at different ages. Each data point indicates that 100% of the embryos in the given treatment group fell into the given wave-position category, unless marked by a different percentage. All values are taken from the graphs in A-D. In syu mutants (gray), the ath5 wave was delayed relative to wild type (black), but it did eventually traverse the entire retina. The delay at 35 hpf showed incomplete penetrance. Starting cyclopamine treatment at 13 hpf also delayed the ath5 wave (orange), but when cyclopamine was given at 25 hpf (green) the rate of wave progression mirrored wild type. CMZ, ciliary marginal zone; cycl., cyclopamine. |
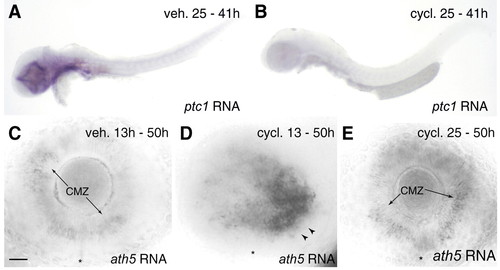
Effects of cyclopamine treatment on Hedgehog pathway activity and ath5 expression. (A,B) Expression of patched1 (ptc1), a target of the Hh signaling pathway, reveals tissues in which the Hh pathway is active. Treatment from 25-41 hpf with cyclopamine (B), but not vehicle (A), drastically reduced or abolished the ptc1 signal (blue stain), indicating effective blockade of Hh signaling. Expression of patched2 was similarly affected (not shown). (C-E) Blockade of Hh signaling at 13 hpf, but not 25 hpf, delays the ath5 wave. Larvae treated with cyclopamine from 13-50 hpf (D) show ath5 expression by temporal retinoblasts (arrowheads), much like a 41 hpf wild type (Fig. 6C) or 50 hpf syu mutant (Fig. 6H). In vehicle-treated larvae (C), as well as larvae treated with cyclopamine from 25-50 hpf (E), the wave is over and ath5 expression is confined to the ciliary marginal zone (arrows). Anterior/nasal is left and dorsal up in all photos. CMZ, ciliary marginal zone; cycl., cyclopamine; veh., vehicle. Scale bar: 25 µm for C-E. |
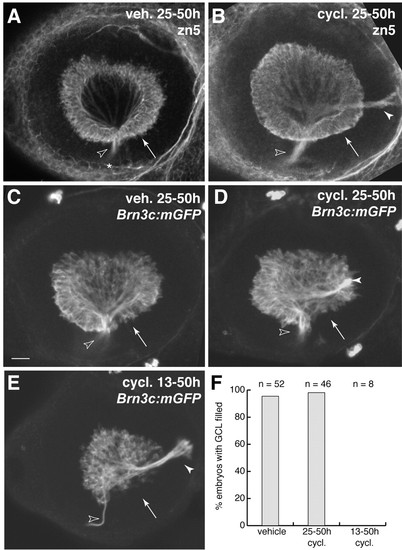
Hedgehog signaling during retinal neurogenesis is not necessary for RGC differentiation. (A-D) Blockade of Hh signaling with cyclopamine at the start of retinal neurogenesis – 25 hpf – does not affect RGC formation. Two different RGC-specific markers, the zn5 antigen (A-B) and a Brn3c:mGFP transgene (C-D) were assessed at 50 hpf. In both vehicle-treated and cyclopamine (25-50 hpf)-treated animals, RGCs filled the entire GCL, including temporal retina (arrows), by 50 hpf. Note that, in wild type (A,C), all RGC axons left the eye via the optic disc (open arrowheads), whereas in cyclopamine animals (B,D) some RGC axons formed an ectopic fascicle projecting to the posterior of the eye (closed arrowheads). (E) Treatment with cyclopamine from 13-50 hpf delays RGC genesis. Note absence of GFP-expressing RGCs from the ventral half of the temporal retina (arrow). Zn5 staining gave similar results (not shown). Axon pathfinding defects were again observed (closed arrowhead). (F) Quantification of the phenotypes shown in A-E. Data were pooled over several experiments. Nearly all the vehicle and 25-50 hpf cyclopamine animals were finished with RGC genesis by 50 hpf, as shown by even filling of the GCL with RGCs. In the 13 hpf cyclopamine group, by contrast, none of the animals had a full GCL. Anterior/nasal is left and dorsal is up in all panels. Open arrowheads mark the optic disc/optic nerve head in all panels. A-E are z-projections of confocal stacks taken through the depth of the GCL. Scale bar: 25 µm. cycl., cyclopamine; veh., vehicle. EXPRESSION / LABELING:
|
Laser ablation of ventronasal retina at 22-28 somites fails to block the ath5 wave. Laser ablation of the ventronasal retinal quadrant was performed on Pax6-DF4:mGFP larvae ranging in age from 22 to 28 somites. The larvae were subsequently sacrificed at 30 hpf (not shown) or 33 hpf (A-D) and stained for ath5 mRNA. All 30 hpf animals lacked ath5 expression in the ablated (but not the intact) eye, indicating that onset of ath5 expression was blocked efficiently in this experiment (n=6; not shown). (A,B) Control (A) and laser-ablated (B) eyes from the same 33 hpf larva. This individual is a representative sample from this experiment – all larvae showed essentially the same phenotype (n=12). In control retinae (A), ath5 is expressed in the ventronasal patch (arrow) and in central retina. In ablated retinae (B), ath5 expression is eliminated from ventronasal retina (arrow) but is expressed normally by central retina cells, suggesting that early ablation of the ventronasal patch does not prevent central retinal cells from expressing ath5 on time. Pyknotic cells were observed in ventronasal retina but are out of the plane of focus of the image in B. (C,D) Control (C) and ablated (D) eyes from another individual in the same experiment. In this individual the ablated region encompasses a much larger area of the retina than was intended. In addition to ventronasal retina, much of the anterior region of central retina has been killed, as indicated by the high density of pyknotic nuclei (D; arrowheads). Nevertheless, ath5 is expressed normally by cells in the temporal half of central retina (arrows). The ath5-expressing cells are just adjacent to the temporal-most extent of the laser-targeted region, as shown by the close apposition of pyknotic and ath5-expressing cells. Thus, joint ablation of ventronasal and antero-central retina does not prevent the ath5 wave from initiating in the temporal half of the retina. Anterior is leftwards and dorsal upwars in all panels. Scale bar: 20 μm. EXPRESSION / LABELING:
|
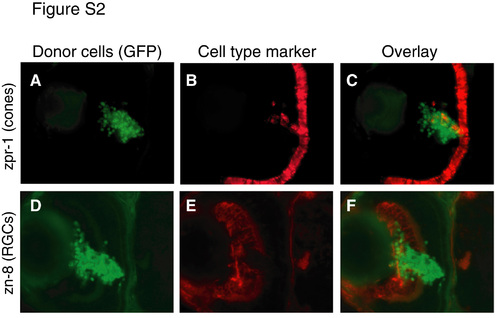
Retinoblasts grafted into host retina differentiate and express RGC and photoreceptor markers. Retinal cells from 30 hpf histone 2A:GFP transgenic fish donors were transplanted into 30 hpf non-transgenic host retina. At 72 hpf, hosts were sectioned and immunostained using zpr-1, a marker of red/green cone photoreceptors (A-C), or zn-8, a marker of RGCs (D-F). Cell type marker analysis was performed on adjacent sections. (A,D) GFP donor cells, green. (B,E) Cell type markers, red. (C,F) Overlay showing expression of cell type markers by donor cells. All hosts examined (n=10) contained zn-8+ and zpr-1+ donor-derived cells. However, many donor cells failed to express either marker (C,F). The percentage of grafted cells in the GCL that failed to differentiate was estimated to be 65-85%. |
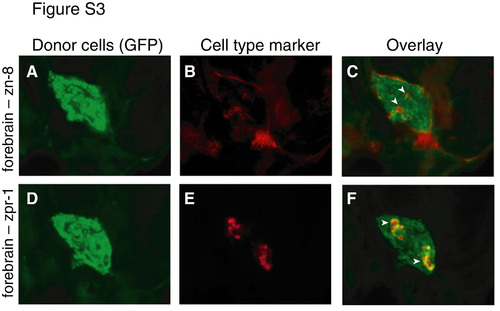
Retinoblasts transplanted to forebrain express RGC and photoreceptor markers. Retinal cells from 30 hpf histone 2A:GFP transgenic fish donors were transplanted into 30 hpf non-transgenic host ventral forebrain. At 72 hpf, hosts (n=4) were sectioned and immunostained with zn-8, a marker of RGCs (A-C), or zpr-1, a marker of red/green cone photoreceptors (D-F). Cell type marker analysis was performed on adjacent sections. Although zn-8 is expressed in both brain and RGCs, zpr-1 is specific for photoreceptors. (A,D) GFP donor cells, green. (B,E) Cell type markers, red. (C,F) Overlay showing expression of cell type markers by donor cells (arrowheads). All hosts contained zpr-1+ donor-derived cells in the forebrain, and half the hosts (n=2/4) showed zn-8+ donor-derived cells. |

Unillustrated author statements EXPRESSION / LABELING:
|